Benchmarking gas transmission access systems in Europe: a traders - - PowerPoint PPT Presentation

benchmarking gas transmission access systems in europe a
SMART_READER_LITE
LIVE PREVIEW

Benchmarking gas transmission access systems in Europe: a traders - - PowerPoint PPT Presentation

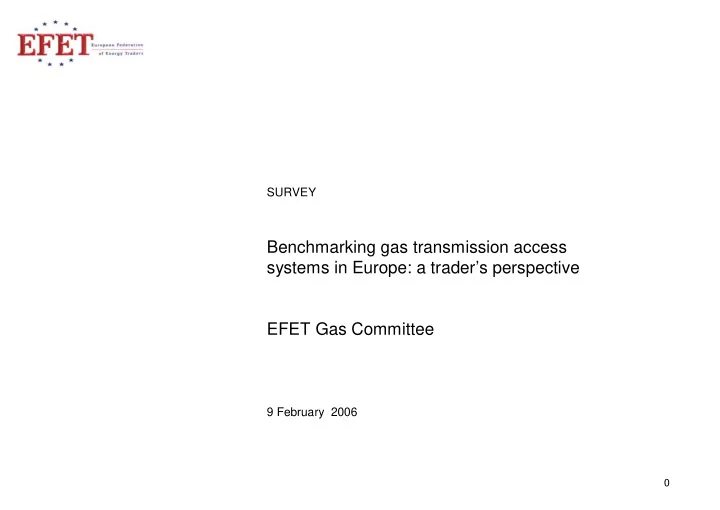
SURVEY Benchmarking gas transmission access systems in Europe: a traders perspective EFET Gas Committee 9 February 2006 0 HIGH LEVEL OBJECTIVES OF EFET GAS TRANSMISSION ACCESS SURVEY The European Federation of Energy Traders, EFET,


slide-1
SLIDE 1

Benchmarking gas transmission access systems in Europe: a trader’s perspective EFET Gas Committee

SURVEY 9 February 2006

slide-2
SLIDE 2

1

The European Federation of Energy Traders, EFET, actively contributes to the development of a transparent and liquid wholesale gas market throughout Europe and in which all consumers have a choice of energy supplier. To achieve this all suppliers must be free to offer innovative solutions to meet customer needs and traders must be able to operate free of artificial restrictions. The benefits of full energy market

  • pening include competitive prices for all customers, a wider range of products, more efficient use of

infrastructure and delivery of security of supply, and increased standards of service, quality of supply and innovation. The establishment of transparent and robust wholesale markets is essential to enable substantive competition and choice of supplier for European consumers. Without effective energy trading there will be no substantive competition in energy supply. Establishing well functioning gas transmission arrangements (entry/exit zones) is a pre-requisite for the development of transparent and liquid traded gas markets. Efet has therefore made an evaluation

  • f the existing gas transmission access systems (entry/exit zones) in Europe against an ideal set of

criteria in order to determine to what extent this goal is reached and what improvement needs to be made.

HIGH LEVEL OBJECTIVES OF EFET GAS TRANSMISSION ACCESS SURVEY

Source: PGEE Teamwork

slide-3
SLIDE 3

2 WORK GROUP ROADMAP - METHODOLOGY Step 1: Definition and content of a gas transmission access system Step 3: Comparative analysis of systems Step 4: Scorecard of zones in Europe Step 2: Map of « zones »

  • Instead of merely countries,

draw a European map of gas zones

  • Add other information (gas

volumes flows and/or exchanges to spot priorities in terms of trading

  • Carry out a benchmarking

process of each zone against well-designed scheme

  • Synthesis of the benchmark

in a scorecard at European level

  • Define a gas transmission

access system with regard to promoting gas trading and secondary capacity trading

  • List items (and perimeters
  • f facilities) constituting a

gas transmission access system

  • State what is a well-

designed system (rather than ideal)

Source: PGEE Teamwork

slide-4
SLIDE 4

3 DEFINITION AND CONTENT OF AN ENTRY EXIT SCHEME

Source: EFET, Project Group

Step 1 –Definition of entry-exit system

Any definition is drawn to serve a business objective. In our case, we felt that an entry-exit system should help foster access to gas (easiness, non-discriminatory, transparency…) at the most efficient cost (information cost, billing…). DEFINITION: An entry-exit system is a specific transportation scheme applicable for a homogeneous zone (with regard to gas quality) within which: §Entry and exit capacity is booked and paid for separately at any number of points within the zone §Trading is facilitated through a virtual hub

–Scope of system: items and facilities

§Number of points - scope of the zone §Tariff structure §Services: –Facilities included – offshore pipelines, storage, LNG, … –Capacity - auction process, duration of capacity, booking procedures, tradability or rights –Balancing rules –Similarity between transit and domestic rules

slide-5
SLIDE 5

Gas transmission access systems in the EU countries (high calorific H-gas only)

Step 2

MAP OF ZONES

VNG

Energinet

Svenska Kraftnät GTS Fluxys

E O N

  • R

. T .

National Grid Gas

EON-R.T.

E O N

  • R

. T . Board Gáis G S O GRTgaz (H) GRTgaz west

GRTgaz east

Enagas Snam Rete Gas

BEB

GRTgaz south Soteg G a s s l e d Z

  • n

e D Galp T r a n s g a s O M V / A G G M DEPA Gasum PGNiG MOL Slovtrans Eesti Gaas Latvijas Gaze L i e t u v

  • s

D u j

  • s

Geoplin Wingas

3 H-gas zones

EON- R.T.

slide-6
SLIDE 6

5 BENCHMARKING OF ZONES ’ SYSTEMS

Step 3 Benchmarking methodology Designing a common methodology to assess each transport system efficiency

Alongside the definition EFET used for conveying its survey, a scorecard methodology was designed internally with the aim of capturing and ranking important topics related to the performance of a gas transmission access system. 6 categories were defined to appraise this: § Area: focus was put on the clarity and simplicity of the area in terms of entry and exit points. § Services: appraisal was conducted on essential services expected for efficient trading (when applicable : entry and exit capacity, balancing, tolerance margins, flexiility, load factor conversion, allocation…). § Capacity booking: analysis of the easiness to book and trade entry and exit capacity on all points. § Commodity trading: key appraisal of gas exchange management (comprise criteria on whether the hub is firm

  • r physical, allows for title of transfer, presence of absence of clearing and fees)

§ Transparency: rates transparency in all aspects listed above § Tariff structure: appraisal in light of fairness, cost-reflectiveness and as a tool for efficient investment decisions

Benchmarking transport systems with a common set of weights

Weights were given to each topics appraised. These weights are standardised and more often than not found applicable to every transport system. The scores collected by a specific transportation system was then normalised by calculation a performance indicator (weighted average of all scores). The relative weights distributed to each category highlights the importance of their content from a trading standpoint. When a criteria was found non applicable to a particular region or transport system, the criteria was discarded in the benchmark grade and score was modified accordingly.

slide-7
SLIDE 7

6 BENCHMARKING OF ZONES ’ SYSTEMS

Step 3 Benchmarking methodology

Source: EFET, Project Group

Definition of Ideal Characteristics

W e i g h t W e i g h t f a c t

  • r

P

  • i

n t s Nr. Topics Items Definition References for awarding points 0-3 1,2,3,4 A. Area 1 Definition of points within the area good understanding of the zone's perimeter 3 = all points listed, with map, online 4 Number of zones in system 3 = one zone 4 B. Services 1 Entry capacity an entry capacity booking service is provided 3 = entry capacity can be booked 1 2 Exit capacity appropriate organisation of exit points as zones and/or points 3 = manageable size of exit points 3 3 Balancing service reflecting requirements of the system (including a market) 3 = 24 balancing market for hourly market 4 4 Tolerance allow for a given margin of metering process error 3 = reasonable tolerance level (standard 2%) 1 5 Flexibility capacity provided by the zones' operator to allow for possibility to reschedule 3 = able to renominate as much as possible, up to end 2 6 Load factor conversion TSO shapes gas according to profile of exit point 3 = TSO takes full responsibility for shaping 2 7 Allocation how and when data is made available and what method is used for the process 3 = instantaneous numbers for balancing 2 8 Matching between TSOs/SSOs for example - connected facilities. TSOs responsibility to monitor 3 = all TSOs need to provide a matching service at interconnections 4 9 Blending needed for specifications (e.g UK - gas), costs incurred 3 = TSO takes full responsibility for blending 2 C. Capacity booking 1 Separate booking Separate booking of entry and exit points 3 = can book separately 4 2 entry only Secondary market TSO faciliates secondary market and secondary trading of capacity 3 = market place, active promote use of, screen based, bulletin board 4 3 entry only Allocation of capacity auctions, first come, first served, etc… 3 = market based, non-discriminatory 3 4 entry only Capacity products What capacity products are on offer - monthly/yearly/daily/etc 3 = variety, can book anything you like 4 5 entry only Booking period when do bookings need to be made and when is a response given 3 = instantaneous, online 3 6 UIOLI principle Use it or lose it principle is applied to ensure capacity is kept free 3 = capacity hoarding is transparent and prevented 4 D. Commodity trading 1 Virtual hub is there a virtual hub to facilitate trading 3 = there is a virtual hub 4 2 Title transfer (incl. Title tracking) is there title transfer facility at the hub 3 = there is a title transfer facility 4 3 Clearing TSO facilitation of clearing process 3 = there is clearing 2 4 Fees Fees should not discourage liquidity 3 = there are no fees 2 E. Transparancy 1 Available capacity publication Numerical, up to date information provided 3 = accurate, numerical, instant information is given for all points 3 2 Booked capacity publication Numerical, up to date information provided 3 = accurate, numerical, instant information is given for all points 3 3 Calculation methods method for calculating capacity levels (booked, available, etc) 3 = method is described, published online 4 4 Balancing method transparency of how the service is provided 3 = method is described, published online 2 5 Tariffs Publication of all tariffs 3 = tariffs are published 4 F. Tariff structure 1 Non-discriminatory Tariffs should not discriminate against any shipper 3 = no discrimination 4 2 Efficiently incurred or market based Costs can be either (eg regulated or auctions) 3 = Tariffs reflective of costs incurred - if not market based due to congestion 2 3 Providing price signals for arbitrage Signal which points are congested/free 3 = signals in place 3 4 Imbalance charges cost reflective and not prohibitive 3 = cost reflective 4 5 Unbundled tariffs for unbundled services Services should be able to be bought separately and charged accordingly 3 = Complete tariff unbundling 3 6 Short Haul Avoids ineffiecient investments and provides flexibility to the entry/exit system 3 = Short haul available 1 G. Useful but not integral to an ideal system 1 Quality conversion capacity to switch one gas quality to another (if necessary) 2 Storage capacity provided by TSO to allow for storage 3 Screen based facilitation TSO supports commodity trading through screen based system

slide-8
SLIDE 8

7

Step 4 –Overall results on gas transmission access systems

BENCHMARKING OF ZONES ’ SYSTEMS

Source: EFET, Project Group

Ranking of gas transmission access systems by comparison with weighted average score

  • 50%
  • 40%
  • 30%
  • 20%
  • 10%

0% 10% 20% 30% 40%

National Grid Gas Energinet.dk Enagas Gas Transport Services GRTgaz Snam Rete Gas Fluxys Gassled OMV Gas BEB RWE Transportnetz Gas EESy E.ON Ruhrgas Transport ENTRIX WINGAS

Distance to average (+ is better than average)

slide-9
SLIDE 9

8

Step 4 –Overall results on gas transmission access systems

BENCHMARKING OF ZONES ’ SYSTEMS

Source: EFET, Project Group

system Points Perf. Distance to Avg Area Services Capacity booking Commodity trading Transpa- rency Tariff structure National Grid Gas 271 94% 28% 24 60 59 36 41 51 Energinet.dk 230 82% 15% 24 49 62 32 32 31 Enagas 212 75% 9% 24 41 44 36 34 33 Gas Transport Services 213 74% 8% 24 37 48 36 32 36 GRTgaz 203 72% 6% 16 38 48 32 28 41 Snam Rete Gas 196 68% 2% 24 38 37 30 36 31 Fluxys 173 60%

  • 6%

12 49 26 28 27 31 Gassled 161 56%

  • 10%

20 51 34 34 22 OMV Gas 157 56%

  • 11%

16 44 30 18 24 25 BEB 146 51%

  • 16%

16 32 38 24 15 21 RWE Transportnetz Gas EESy 85 30%

  • 37%

4 18 35 10 8 10 E.ON Ruhrgas Transport ENTRIX 82 28%

  • 38%

8 24 31 11 8 WINGAS 78 27%

  • 39%

8 15 31 18 6 Average 170 66% 0% 17 38 40 22 26 27

slide-10
SLIDE 10

9

Area Services Capacity booking Commodity trading Transpa-rency Tariff structure Maximum Rating National Grid Gas Average

BENCHMARKING OF ZONES ’ SYSTEMS

Step 4 –Detailed results on gas transmission access systems

  • Strong points : Virtual hub supported by a title transfer

facility, flexibility on capacity booking

  • Improvements needed : transparency on capacity levels

calculation, balancing service and charges

  • Strong points : Virtual hub supported by a title transfer

facility, flexibility on capacity booking, transparency (overall), tariff structure

  • Improvements needed : transparency on capacity levels

calculation

Area Services Capacity booking Commodity trading Transpa-rency Tariff structure Maximum Rating Energinet.dk Average

slide-11
SLIDE 11

10

Area Services Capacity booking Commodity trading Transpa-rency Tariff structure Maximum Rating GRTgaz Average

BENCHMARKING OF ZONES ’ SYSTEMS

–Detailed results on gas transmission access systems

  • Strong points : Virtual hub supported by a title transfer

facility, flexibility on capacity booking

  • Improvements needed : numerous exit points,

secondary market for capacity, improvements in imbalance charges

  • Strong points : Virtual hub supported by a title transfer

facility, flexibility on capacity booking, UIOLOI

  • Improvements needed : reduction of zones, liquidity,

secondary market on capacity

Step 4

Area Services Capacity booking Commodity trading Transpa-rency Tariff structure Maximum Rating Gas Transport Services Average

slide-12
SLIDE 12

11

Area Services Capacity booking Commodity trading Transpa-rency Tariff structure Maximum Rating BEB Average

BENCHMARKING OF ZONES ’ SYSTEMS

–Detailed results on gas transmission access systems

  • Strong points : facility supported by a title transfer

facility, transparency on tariffs, capacity products

  • Improvements needed : not a virtual hub, no separate

booking of entry and exit, number of zones

  • Strong points : Virtual hub, with separate booking on

entry and exit capacity

  • Improvements needed : transparency on capacity

levels, balancing service and charges

Step 4

Area Services Capacity booking Commodity trading Transpa-rency Tariff structure Maximum Rating Fluxys Average

slide-13
SLIDE 13

12

Area Services Capacity booking Commodity trading Transpa-rency Tariff structure Maximum Rating Enagas Average

BENCHMARKING OF ZONES ’ SYSTEMS

–Detailed results on gas transmission access systems

  • Strong points : single area, virtual hub, separate booking
  • f entry and exit, non discriminatory tariff
  • Improvements needed : no title transfer facility,capacity

products, non efficient or cost incurred charges

  • Strong points : separate booking of entry and exit,

capacity publication, non discriminatory tariff

  • Improvements needed : non efficient or cost incurred

charges

Step 4

Area Services Capacity booking Commodity trading Transpa-rency Tariff structure Maximum Rating Snam Rete Gas Average

slide-14
SLIDE 14

13

Area Services Capacity booking Commodity trading Transpa-rency Tariff structure Maximum Rating RWE Transportnetz Gas EESy Average

BENCHMARKING OF ZONES ’ SYSTEMS

–Detailed results on gas transmission access systems

  • Strong points : separate booking of entry and exit,

capacity products

  • Improvements needed : nine zones, no virtual hub

expect on zones, no title transfer facility, non efficient or cost incurred charges, transparency (in general)

  • Strong points : separate booking of entry and exit,

capacity products

  • Improvements needed : five zones, no virtual hub

expect on zones, no title transfer facility, non efficient or cost incurred charges, transparency (in general)

Step 4

Area Services Capacity booking Commodity trading Transpa-rency Tariff structure Maximum Rating E.ON Ruhrgas Transport ENTRIX Average

slide-15
SLIDE 15

14

Area Services Capacity booking Commodity trading Transpa-rency Tariff structure Maximum Rating WINGAS Average

–Detailed results on gas transmission access systems

BENCHMARKING OF ZONES ’ SYSTEMS

  • Strong points : separate booking of entry and exit,

capacity products

  • Improvements needed : four zones, 73 exit points, no

virtual hub expect on zones, no title transfer facility, no tolerance, transparency (in general)

  • Strong points : capacity products, balancing, non

discriminatory tariff

  • Improvements needed : no virtual hub, no title transfer

facility, non efficient or cost incurred charges,

Step 4

Area Services Capacity booking Commodity trading Transpa-rency Tariff structure Maximum Rating Gassled Average

slide-16
SLIDE 16

15

Area Services Capacity booking Commodity trading Transpa-rency Tariff structure Maximum Rating OMV Gas Average

–Detailed results on gas transmission access systems

  • Strong points : virtual hub
  • Improvements needed : no title transfer facility, capacity

booking and allocation, transparency (in general) BENCHMARKING OF ZONES ’ SYSTEMS

Step 4

slide-17
SLIDE 17

16 BENCHMARKING OF ZONES ’ SYSTEMS

Step 4 –Summary improvements needed for gas transmission access systems National Grid Gas transparency on capacity levels calculation Energinet.dk transparency on capacity levels calculation, balancing service and charges Enagas non efficient or cost incurred charges Gas Transport services numerous exit points, secondary market for capacity, improvements in imbalance charges GdF Transport reduction of zones, liquidity, secondary market on capacity Snam Rete Gas no title transfer facility,capacity products, non efficient or cost incurred charges Fluxys not a virtual hub, no separate booking of entry and exit, number

  • f zones

Gassco no virtual hub, no title transfer facility, non efficient or cost incurred charges

slide-18
SLIDE 18

17 BENCHMARKING OF ZONES ’ SYSTEMS

Step 4 –Summary improvements needed for gas transmission access systems OMV Gas no title transfer facility, capacity booking and allocation, transparency (in general) BEB transparency on capacity levels, balancing service and charges RWE Transportnetz Gas EESy nine zones, no virtual hub expect on zones, no title transfer facility, non efficient or cost incurred charges, transparency (in general) E.ON Ruhrgas Transport ENTRIX five zones, no virtual hub expect on zones, no title transfer facility, non efficient or cost incurred charges, transparency (in general) WINGAS four zones, 73 exit points, no virtual hub expect on zones, no title transfer facility, no tolerance, transparency (in general)

Changes to gas transmission access systems in Germany based on the new model recently published are not considered herein.

slide-19
SLIDE 19

18 FEEDBACK FROM TSOs

TSOs As mentioned earlier, EFET submitted its first version of the appraisal scorecard to GTE for its consideration asking for comments of feedback from its members. By the time of the closing, the Group has collected and analysed a few answers from individual TSOs (Snam Rete Gas, Gas Transport System, OMV, Enagas). Others requested meetings or provided general feedback. The Group welcomed the interest of TSOs with this study and their comments. These were carefully analysed and when it was applicable changed the grade structure. Way forward EFET welcomes this opportunity to invite all participants in the energy sector to join and discuss all actions that could be seen as necessary to improve gas trading efficiency and energy market liberalisation. EFET will be happy to discuss the results of this survey – being a single perspective – and help design action plans to achieve this goal.