Baseline porewater and soil organic matter sampling at Bayou aux C - - PowerPoint PPT Presentation

baseline porewater and soil organic matter sampling at
SMART_READER_LITE
LIVE PREVIEW

Baseline porewater and soil organic matter sampling at Bayou aux C - - PowerPoint PPT Presentation

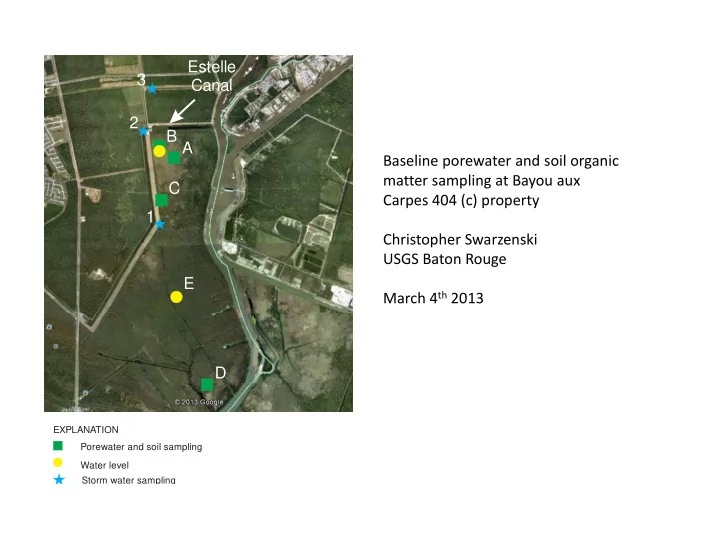
Estelle 3 Canal 2 B A Baseline porewater and soil organic matter sampling at Bayou aux C Carpes 404 (c) property 1 Christopher Swarzenski Christopher Swarzenski USGS Baton Rouge E March 4 th 2013 D EXPLANATION Porewater and soil sampling


slide-1
SLIDE 1

3 Estelle Canal A B 2 Baseline porewater and soil organic C 1 matter sampling at Bayou aux Carpes 404 (c) property Christopher Swarzenski E Christopher Swarzenski USGS Baton Rouge March 4th 2013 D

Porewater and soil sampling EXPLANATION Water level Storm water sampling

slide-2
SLIDE 2

Soils appear robust, healthy; porewater and fiber content data indicate breakdown of organic matter highest at site B, closest to Estelle Canal influx note: did not measure fiber content at site D because of Typha ingrowth

non-fractionated as a percent of original volume

ent

100

u m

1.6

B

Fiber content in perce

40 50 60 70 80 90

fractionated as a percent of orginal volume

a t i

  • d

i s s

  • l

v e d c a l c i u t

  • m

a g n e s i u m

1.0 1.1 1.2 1.3 1.4 1.5 Direct entry of Estelle Canal water to marshes

p g

Fiber content in percent

40 50 60 70 80 90 100

Salinity (ppt)

0.0 0.5 1.0 1.5 2.0 2.5

R a

0.8 0.9 1.0

M as N) 30 35

fractionated as a percentage of non-fractionated volume

iber content in percent

50 60 70 80 90

ed ammonium (uM 5 10 15 20 25 30

B

F

40

  • P. hemitomon

(average of four marshes) mixed (edge, non- floating)

  • P. hemitomon

(gage, non-floating)

  • P. hemitomon

(interior, floating) Figure 8. Fiber content analysis of soil samples at Bayou aux Carpes marshes. Values are compared with the averages from a control group of four marshes dominated by P. hemitomon at the Barataria Preserve of Jean Lafitte National Historical Park and Preserve. Values are averaged in 5-cm increments for the top 25 cm, with three replicates per depth interval.

Dissolve 20 40 60 80 100 120 5 Dissolved ortho-phosphate (uM as P)

slide-3
SLIDE 3

Atrazine and fipronil concentrations in surface waters sampled March 22, 2011

3 Pumping Stations

  • n

f no flo

Runoff purposely sampled during a period when d

2

  • ff
  • w

concentrations were expected to be at a peak; No inferences possible about

SITE Atrazine (ug/l) Fipronil (ug/l) Carbaryl (ug/l) Metalo‐ chlor (ug/l)

p actual loads or potential exposure of marshes to contaminants

1 0.146 < 0.018 b.d. b.d. 2 0.238 < 0.018 b.d. b.d. 3 9.14 0.046 0.095 0.095 Detection lvl 0.008 0.018 0.060 0.020

slide-4
SLIDE 4

Water level gradients in wetlands and water surrounding the BAC 404 (c) property

Swamp (match peak of COR gage adjusted to CRMS 185) Marsh (match to TS Lee peak of COR gage adjusted to CRMS 185) CRMS 185 unadjusted

Hydraulic gradient appears to be from north

2 3 j subtract .51 from Corps gage to approximate CRMS 185 beyond start date

appears to be from north to south wetlands and then to Pipeline canal/GIWW majority of i h l l

R LEVEL IN FEET

1

time; marsh water levels higher than swamp. Assumption: During

WATER

  • 1

p g Tropical Storm Isaac, peaks of all water level stations are assumed to match

Date

2/1/11 4/1/11 6/1/11 8/1/11 10/1/11 12/1/11

  • 2

match