
SLIDE 1
Backup Q3 2004.
Investor Relations, Bonn office Phone +49 228 181 -8 88 80 Fax +49 228 181 -8 88 99 E-Mail investor.relations@telekom.de Investor Relations, New York office Phone +1 212 424 2926 Phone + 1 877 DT SHARE (toll-free) Fax +1 212 424 2986 E-Mail investor.relations@ usa.telekom.de This backup, the presentation and the audio webcast can be downloaded from the Investor Relations site on the internet at www.telekom.de or www.deutschetelekom.com. For further information on the divisions please refer to: www.t-com.de www.t-mobile.de www.t-systems.com www.t-online.de
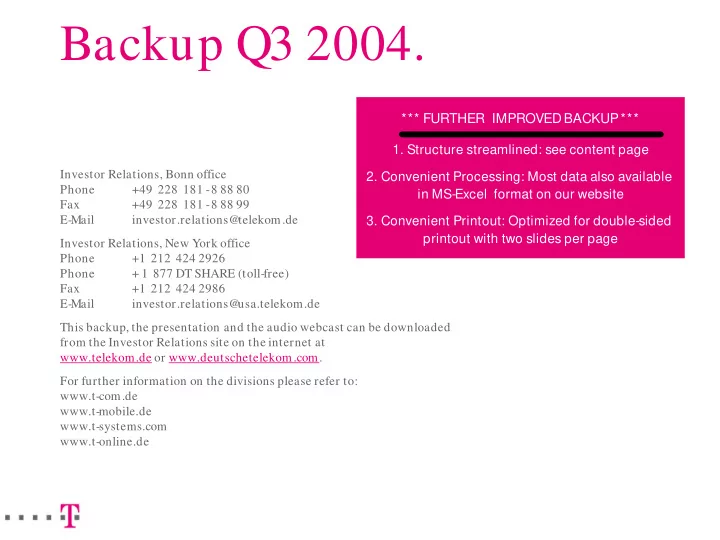
*** FURTHER IMPROVED BACKUP ***
- 1. Structure streamlined: see content page
- 2. Convenient Processing: Most data also available
in MS-Excel format on our website
- 3. Convenient Printout: Optimized for double-sided
printout with two slides per page