SLIDE 1
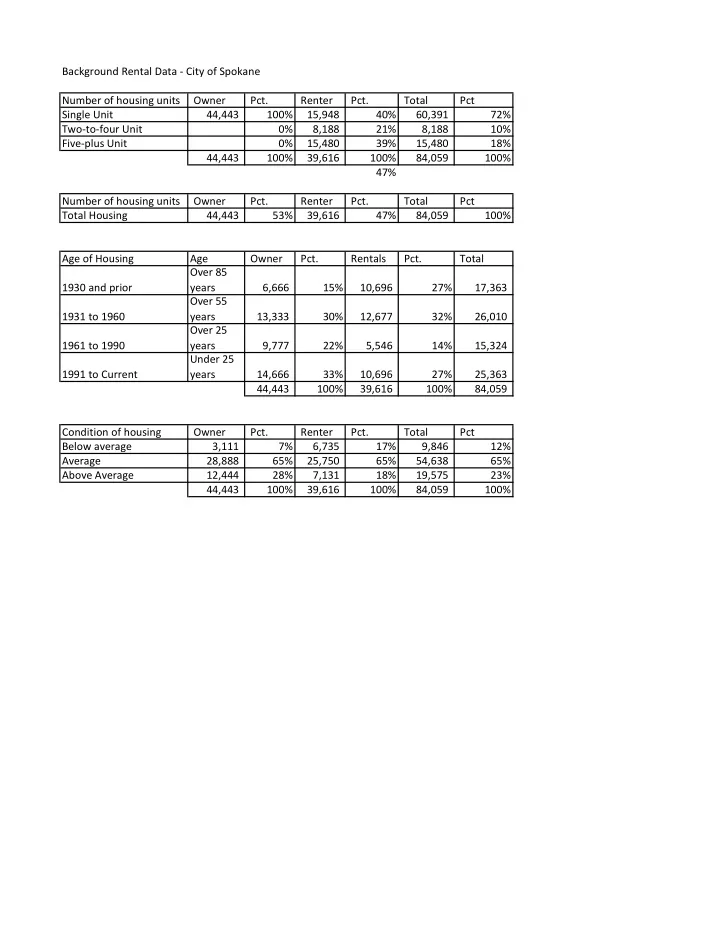
Background Rental Data - City of Spokane Number of housing units Owner Pct. Renter Pct. Total Pct Single Unit 44,443 100% 15,948 40% 60,391 72% Two-to-four Unit 0% 8,188 21% 8,188 10% Five-plus Unit 0% 15,480 39% 15,480 18% 44,443 100% 39,616 100% 84,059 100% 47% Number of housing units Owner Pct. Renter Pct. Total Pct Total Housing 44,443 53% 39,616 47% 84,059 100% Age of Housing Age Owner Pct. Rentals Pct. Total 1930 and prior Over 85 years 6,666 15% 10,696 27% 17,363 1931 to 1960 Over 55 years 13,333 30% 12,677 32% 26,010 1961 to 1990 Over 25 years 9,777 22% 5,546 14% 15,324 1991 to Current Under 25 years 14,666 33% 10,696 27% 25,363 44,443 100% 39,616 100% 84,059 Condition of housing Owner Pct. Renter Pct. Total Pct Below average 3,111 7% 6,735 17% 9,846 12% Average 28,888 65% 25,750 65% 54,638 65% Above Average 12,444 28% 7,131 18% 19,575 23% 44,443 100% 39,616 100% 84,059 100%
SLIDE 2
Population Demographics
Population Spokane County City of Spokane Persons below poverty line 76,910 42,201 Est: Households below poverty line 30,764 17,584 Est: % of rental units occupied by households under poverty line 44% Population 484,318 212,067 Per capita income 26,235 24,848 Median household income 50,249 43,694 Household income under $50k 50.0% 55.0% Persons below poverty line % 16.4% 19.9% 42,201 Poverty Children (under 18) 20.0% 25.0% Poverty Seniors (65 and over) 9.0% 12.0% Number of households 187,603 85,300 Persons per household 2.5 2.4 Number of housing Units 206,106 95,947
Source: https://censusreporter.org/profiles/16000US5367000-spokane-wa/
SLIDE 3
Households and Renters below Poverty Line Owner Occupied 44,443 Renter in poverty 17,584 44% Renter 22,032 84,059 Renters below Poverty Owner Occupied, 44,443 , 53% Renter in poverty, 17,584 , 21% Renter, 22,032 , 26%
SLIDE 4
Economics of Renter Properties Owner Renter Total Single Unit 44,443 15,948 60,391 Two-to-four Unit 8,188 8,188 Five-plus Unit 15,480 15,480 Total Renter Properties 44,443 39,616 84,059 53% 47% Renter Properties Avge $ Total $ Single Unit 15,948 115,000 1,834,020,000 Two-to-four Unit 8,188 55,000 450,340,000 Five-plus Unit 15,480 50,000 774,000,000 Total Renter Properties 39,616 3,058,360,000 City Income Renter Properties Avge / yr Total/yr Avge / mth Total / yr Total / yr Single Unit 15,948 2,000 31,896,000 100 19,137,600 51,033,600 Two-to-four Unit 8,188 750 6,141,000 50 4,912,800 11,053,800 Five-plus Unit 15,480 750 11,610,000 50 9,288,000 20,898,000 Total Renter Properties 39,616 49,647,000 33,338,400 82,985,400 % of City 2016 Budget 6% 4% 10% Renter Avge / mth Total / yr Single Unit 15,948 800 153,100,800 Two-to-four Unit 8,188 500 49,128,000 Five-plus Unit 15,480 500 92,880,000 Total Renter Properties 39,616 295,108,800 % of City 2016 Budget 36% 1.7% $ M GDP 2008 City of Spokane 17,640 Real Estate and Rental and Leasing 2,041 12%
http://econpost.com/gdp/spokane-washington-gdp-table-2008
Property Taxes Utilities Rental income Property Values
SLIDE 5
Age of Rental Properties Construction year Rental properties % 1930 and prior 10,696 27% 1931 to 1960 12,677 32% 1961 to 1990 5,546 14% 1991 to Current 10,696 27% 39,616 100% Age of Rental Propeties 1930 and prior, 10,696 , 27% 1931 to 1960, 12,677 , 32% 1961 to 1990, 5,546 , 14% 1991 to Current, 10,696 , 27%
SLIDE 6
Condition of Properties (as defined by City of Spokane) Owner Pct. Renter Pct. Total Pct. Below average 3,111 7% 6,735 17% 9,846 12% Average 28,888 65% 25,750 65% 54,638 65% Above Average 12,444 28% 7,131 18% 19,575 23% 44,443 100% 39,616 100% 84,059 100% Condition of Renter Properties Below average, 6,735 , 17% Average, 25,750 , 65% Above Average, 7,131 , 18%
SLIDE 7
6.2.1 Share of Renters Paying 30% or More of Their Household Income for Rent Location Measure 2010 2011 2012 2013 2014 United States Share 53% 53% 52% 52% 52% Washington State Share 51% 51% 51% 51% 50% Spokane County Share 53% 54% 56% 54% 52% City of Spokane Share 55% 57% 54% 57% 52% City of Spokane Valley Share 57% 49% 53% 58% 54%
http://www.communityindicators.ewu.edu/graph.cfm?cat_id=6&sub_cat_id=2&ind_id=1
SLIDE 8
1260
SLIDE 9 Source: http://www.bestplaces.net/housing/city/washington/spokane HOUSING Median Home Age "The average age of homes in years. Updated: June, 2014" Median Home Cost "This is the value of the years most recent home sales data. Its important to note that this is not the average (or arithmetic mean). The median home price is the middle value when you arrange all the sales prices of homes from lowest to highest. This is a better indicator than the average, because the median is not changed as much by a few unusually high or low values. Updated: June, 2014" Home Appr. Last 12 months "House appreciation - last 12 months Updated: June, 2014" Home Appr. Last 5 yrs. "House appreciation - last 5 years Updated: June, 2014" Home Appr. Last 10 yrs. "House appreciation - last 10 years Updated: June, 2014" Property Tax Rate "The property tax rate shown here is the rate per $1,000 of home value. If the tax rate is $14.00 and the home value is $250,000, the property tax would be $14.00 x ($250,000/1000), or $3500. This is the 'effective' tax
- rate. Updated: June, 2014"
Homes Owned "The percentage of housing units which are owned by the occupant. A housing unit is a house, apartment, mobile home, or room occupied as separate living quarters. Updated: June, 2014" Housing Vacant "The percentage of housing units which are vacant (unoccupied). A housing unit is a house, apartment, mobile home, or room occupied as separate living quarters. Updated: June, 2014" Homes Rented "The percentage of housing units which are rented by the occupant. A housing unit is a house, apartment, mobile home, or room occupied as separate living quarters. Updated: June, 2014" AVERAGE RENT FOR HOME OR APARTMENT Studio Apartment "Average rent for studio apartment Updated: June, 2014" 1 Bedroom Home or Apartment "Average rent for 1-bedroom home or apartment Updated: June, 2014" 2 Bedroom Home or Apartment "Average rent for 2-bedroom home or apartment Updated: June, 2014" 3 Bedroom Home or Apartment "Average rent for 3-bedroom home or apartment Updated: June, 2014" 4 Bedroom Home or Apartment "Average rent for 4-bedroom home or apartment Updated: June, 2014" VACANT HOUSING Vacant For Rent "Vacant housing - for rent Updated: June, 2014" Vacant Rented "Vacant housing - rented Updated: June, 2014" Vacant For Sale "Vacant housing - for sale Updated: June, 2014" Vacant Sold "Vacant housing - sold Updated: June, 2014" Vacant Vacation "Vacant housing - seasonal, recreational or occasional use Updated: June, 2014" Vacant Other "Vacant housing - other Updated: June, 2014" VALUE OF OWNER-OCCUPIED HOUSING Less Than $20,000 "Percentage of Home Values less than $20,000. Updated: June, 2014" $20,000 to $39,999 "Percentage of Home Values between $20,000 and $39,999. Updated: June, 2014" $40,000 to $59,999 "Percentage of Home Values between $40,000 and $59,999. Updated: June, 2014" $60,000 to $79,999 "Percentage of Home Values between $60,000 and $79,999. Updated: June, 2014" $80,000 to $99,999 "Percentage of Home Values between $80,000 to $99,999 Updated: June, 2014" $100,000 to $149,999 "Percentage of Home Values between $100,000 to $149,999. Updated: June, 2014" $150,000 to $199,999 "Percentage of Home Values between $150,000 to $199,999. Updated: June, 2014" $200,000 to $299,999 "Percentage of Home Values between $200,000 to $299,999. Updated: June, 2014" $300,000 to $399,999 "Percentage of Home Values between $300,000 to $399,999. Updated: June, 2014" $400,000 to $499,999 "Percentage of Home Values between $400,000 to $499,999. Updated: June, 2014" $500,000 to $749,999 "Percentage of Home Values between $500,000 to $749,999. Updated: June, 2014" $750,000 to $999,999 "Percentage of Home Values between $750,000 to $999,999. Updated: June, 2014" $1,000,000 or more "Percentage of Home Values greater than $1,000,000 or more. Updated: June, 2014" HOUSING UNITS BY YEAR STRUCTURE BUILT 2010 and newer "2010 and newer Updated: June, 2014" 2000 to 2009 "2000 to 2009 Updated: June, 2014" 1990 to 1999 "1990 to 1999 Updated: June, 2014" 1980 to 1989 "Percentage of Housing Units by Structure Built 1980 to 1989. Updated: June, 2014" 1970 to 1979 "Percentage of Housing Units by Structure Built 1970 to 1979. Updated: June, 2014" 1960 to 1969 "Percentage of Housing Units by Structure Built 1960 to 1969. Updated: June, 2014" 1950 to 1959 "Percentage of Housing Units by Structure Built 1950 to 1959. Updated: June, 2014" 1940 to 1949 "Percentage of Housing Units by Structure Built 1940 to 1949. Updated: June, 2014"
SLIDE 10
1939 or Earlier "Percentage of Housing Units by Structure Built 1939 or Earlier. Updated: June, 2014"
SLIDE 11 Spokane, Washington United States 54 37 $131,000 $170,100 0.70% 4.90%
31.30% 12.70% $12.32 $12.07 52.78% 57.34% 7.41% 12.47% 39.81% 30.19% 2015? $470 $661 $574 $765 $776 $957 $1,110 $1,289 $1,260 $1,490 2.83% 2.50% 0.40% 0.46% 1.10% 1.38% 0.09% 0.46% 0.41% 3.81% 2.56% 3.87% 2.11% 3.30% 1.00% 3.44% 1.08% 4.18% 2.98% 5.80% 6.46% 7.08% 28.22% 15.77% 23.09% 15.03% 21.76% 18.50% 6.93% 10.39% 3.11% 5.66% 2.24% 6.39% 0.67% 2.28% 0.36% 2.18% 0.16% 0.29% 8.00% 14.18% 9.52% 13.96% 8.16% 13.99% 14.22% 16.09% 9.52% 13.96% 15.45% 11.05% 9.83% 5.59% 200 400 600 800 1000 1200 1400 AVER RENT HOM APART
SLIDE 12
28.23% 13.68%
SLIDE 13
RAGE FOR E OR MENT Studio Apartment "Average rent for studio apartment Updated: June, 2014" 1 Bedroom Home or Apartment "Average rent for 1-bedroom home or apartment Updated: June, 2014" 2 Bedroom Home or Apartment "Average rent for 2-bedroom home or apartment Updated: June, 2014" 3 Bedroom Home or Apartment "Average rent for 3-bedroom home or apartment Updated: June, 2014" 4 Bedroom Home or Apartment "Average rent for 4-bedroom home or apartment Updated: June, 2014" Series1
SLIDE 14 Profit per year (after setting aside money for structural and equipment repairs) Cash on Cash return per year (no funds set aside for structural repairs or major replacements) Property Value Average price of a house 120,000 Loan 70% of property value 70% 84,000 Building Value Say 80% 80% 96,000 Rent Monthly rent say 850 10,200 10,200 Vacancy Rate 2.5% (255) (255) Property Management Fees 8% (816) (816) Taxes Property County Property Taxes 1,300 (1,300) (1,300) Taxes Utilities City Taxes (Sewer Garbage) not reimbursed by tenants 700 (700) (700) Insurance Insurance 500 (500) (500) Repairs - annual 1% of property value 1% 960 (960) (960) Repairs - structural repairs Replace house in 27 years per IRS tax guidelines 27 3,556 (3,556) Interest Rate Est 5% repayments on bank loan 5% 4,200 (4,200) (4,200) (Loss) / Profit $ (2,087) 1,469 (Loss) / Profit on Property Value
1.22% Based on a 3 bedroom single family home in zipcode 99205 (North Central Spokane)
SLIDE 15 Apartment - 2 bedroom Profit (LOSS) /yr (after providing for long term replacements) Cash on Cash return Property Value 70,000 Loan 70% of property value 70% 49,000 Building Value Say 80% 80% 56,000 Rent Monthly rent say 600 7,200 7,200 Vacancy Rate 3% (180) (180) Property Management 8% (576) (576) Taxes City Taxes 2,000 (2,000) (2,000) Repairs - annual 1% of property value 1% 560 (560) (560) Repairs - structural repairs Replace house in 27 years 27 2,074 (2,074) Interest Rate Est 5% 5% 2,450 (2,450) (2,450) (Loss) / Profit $ (640) 1,434 (Loss) / Profit on Property Value %
2.05%