Link Spokane: Integrating Transportation & Utility - - PowerPoint PPT Presentation

link spokane
SMART_READER_LITE
LIVE PREVIEW

Link Spokane: Integrating Transportation & Utility - - PowerPoint PPT Presentation

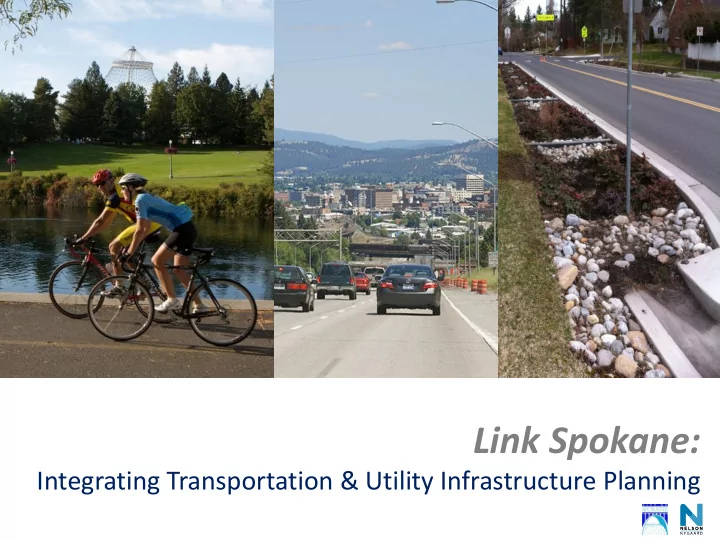
Link Spokane: Integrating Transportation & Utility Infrastructure Planning Overview What is Link Spokane? How Spokane Got Here Review of Draft Evaluation Criteria Implementing Link Spokane Best Practices in Transportation


slide-1
SLIDE 1

Link Spokane:

Integrating Transportation & Utility Infrastructure Planning

slide-2
SLIDE 2

Overview

  • What is Link Spokane?
  • How Spokane Got Here
  • Review of Draft Evaluation Criteria
  • Implementing Link Spokane
  • Best Practices in Transportation
  • Discussion
slide-3
SLIDE 3

What is Link Spokane?

  • Update of the Transportation Chapter of the

Spokane Comprehensive Plan including portions of the Capital Facilities Chapter.

  • Address the current and future needs of all

modes of transportation including cars, freight, transit, pedestrians and bicyclists.

  • Designed to be fully integrated with other City

investments in utilities and infrastructure.

slide-4
SLIDE 4

Key Themes - Easy Access

Cities are an invention to maximize exchange (goods, culture, friendship, knowledge) and to minimize travel. The role of transport is to maximize exchange …David Engwicht

slide-5
SLIDE 5

1948

slide-6
SLIDE 6

2007

slide-7
SLIDE 7

Streetcar History - 1923

slide-8
SLIDE 8
slide-9
SLIDE 9
slide-10
SLIDE 10

10

slide-11
SLIDE 11

11

slide-12
SLIDE 12

What’s different about Link Spokane?

slide-13
SLIDE 13

Link Spokane Vision

slide-14
SLIDE 14

Relationship to Existing Transportation Chapter

14

slide-15
SLIDE 15

Existing Transportation Chapter Goals

TR 1: Overall Transportation TR 2: Transportation Options TR 3: Transportation and Land Use TR 4: Efficient + Safe Mobility TR 5: Neighborhood Protection TR 6: Environmental Protection TR 7: Sense of Place TR 8: Regional Planning TR 9: Equitable Funding TR 10: The Future

15

2013 Audit found weak correlation between goals and built environment

slide-16
SLIDE 16

Policies by Goals

1 22 6 25 7 8 6 5 3 3

Overall Transportation Transportation Options Transportation + Land Use Efficient + Safe Mobility Neighborhood Protection Environmental Protection Sense of Place Regional Planning Equitable Funding The Future

16

slide-17
SLIDE 17

Transportation Vision Statement

“Citizens of Spokane will have a variety of transportation choices that allow easy access and mobility throughout the region and that respect property and the environment”

17

slide-18
SLIDE 18
  • Provide transportation choices.
  • Accommodate access to daily needs &

regional destinations.

  • Promote economic opportunity & fiscal

responsibility.

  • Respect natural and neighborhood assets.
  • Enhance public health and safety.
  • Maximize public benefits with integrated

public investments.

Link Spokane Draft Evaluation Criteria

slide-19
SLIDE 19

Provide Transportation Choices

TR 8 Regional Planning TR 2 Transportation Options TR 1 Overall Transportation

slide-20
SLIDE 20

1:Overall Transportation 2:Transportation Options 3:Transportation and Land Use 4:Efficient + Safe Mobility 5:Neighborhood Protection 6:Environmental Protection 7:Sense of Place 8:Regional Planning 9:Equitable Funding 10:The Future

Transportation choices Economic opportunity Public health and safety Neighborhood assets Natural assets Access to regional destinations Fiscal responsibility Integrated investments

slide-21
SLIDE 21

6’8” parking lane – drivers park on the

  • sidewalk. Location: Sprague Ave
slide-22
SLIDE 22

On-street parking allowed but unutilized adds to driver speed. Location: Bernard St

slide-23
SLIDE 23

Five Mile Road Addison Street

A 4.5’ bike lane and a 14’ travel lane. Location: SE Boulevard

slide-24
SLIDE 24

A bus rider runs across five lanes of traffic after alighting from the bus. Closest signalized crossing 0.25 miles away. Location: Francis & Belt

slide-25
SLIDE 25
  • Current Design Standard (DS)

– Through lanes: 12’ – Center turn lane – 14’ – Parking lane – 8’

  • Current Standard (Comp Plan)

– Principal/Minor Arterials: 12’ outer, 11’ inner – Collectors 12’ outer, 10’ inner – Parking lane – 7’ residential, 8’ collectors/arterials

slide-26
SLIDE 26

Research and Data - Travel Lane Width

Safety

  • No indication, expect in

limited cases, that narrower lanes increase crash frequencies. (Potts, Petritsch)

  • Wider lanes linked to higher
  • speeds. Higher speeds increase

likelihood and severity of crashes. Capacity Research

  • Capacity is not degraded until

lane width is reduced to less than 10’ (Petritsch)

– Dumbaugh, Eric. “Safe Streets, Livable Streets.” JAPA. Summer 2005. – Texas Transportation Institute. “Design Factors that affect driver speed on suburban arterials.” – Potts, Howard, and Richard. “Relationship of lane width to safety for urban and suburban arterials.” TRB 2007. – Petritsch, Theodore. “The influence of lane widths on safety and capacity.”

slide-27
SLIDE 27
slide-28
SLIDE 28

Riverside Ave. – Spokane, WA

slide-29
SLIDE 29

Riverside Ave. – Spokane, WA

slide-30
SLIDE 30

1930

Transportation Choices

2010 Main Street Spokane, WA

slide-31
SLIDE 31

Conventional Approach More Efficiency System Management More Pavement More Lanes More Roads ITS More Cars

Conventional Approach

slide-32
SLIDE 32

Lateral Approach User View and Comfort Context-Sensitive Design Traffic Calming Personal Security Mix of Uses Road Network Pedestrian-Oriented Environment Compact Development Lane Limits Change Standards Manage, Not “Solve” Conventional Approach More Efficiency More Lanes More Roads More Cars Transit Bicycling Walking HOV/HOT Lanes System Management More Pavement ITS

Balanced Approach

slide-33
SLIDE 33

500 1,000 1,500 2,000 2,500 3,000 1960 1965 1970 1975 1980 1985 1990 1995

Billions of Miles Traveled

1,000 2,000 3,000 4,000 5,000 6,000 7,000 8,000

Billions of Dollars Highway VMT GDP

Transportation’s Power

slide-34
SLIDE 34

Updating the Transportation Policy Framework

  • Develop direct evaluation criteria and align policies

to make them more clear, objective and implementable.

  • Evaluate, prioritize, fund and build transportation

projects based on performance metrics.

  • Refine transportation Level of Service (LOS)

standards to reflect goals and policies.

  • Update Street Design Standards for future roads and

street rehabilitation projects.

1/13/2016 34

slide-35
SLIDE 35

Overview of Project Screening Process

Universe

  • f

Projects

Project- Level Screening

Tiered List of Projects Develop Plan Scenarios

Package- Level Screening

Recommended Future Network

slide-36
SLIDE 36

Community- Driven Process

slide-37
SLIDE 37

Level of Service (LOS) Standards:

Implementing Link Spokane

37

slide-38
SLIDE 38

Multi-modal Quality of Service

Balance and prioritize design to meet street’s purpose

slide-39
SLIDE 39

Resulting Multi-modal Impact Fee Projects

  • New traffic signals
  • Additional lanes at

intersections

  • New arterial connections
  • Sidewalk infill
  • Right-sizing
  • Bike lanes
  • Crosswalk improvements

39

slide-40
SLIDE 40

Best Practices:

Implementing Link Spokane

slide-41
SLIDE 41

Best Practice Local Application

Garland District, Spokane Neighborhood serving retail within walkable/bikeable distances in Denver Garland neighborhood as a local blueprint

Draft Evaluation Criteria

  • Accommodates access to daily

needs and regional destinations

  • Promote economic opportunity and

fiscal responsibility

  • Promote public health and safety
slide-42
SLIDE 42

Best Practice

Bus Rapid Transit, Eugene, OR

  • Provide transportation choices
  • Accommodate access to daily needs

and regional destinations

  • Promote public health and safety
  • Respect natural and neighborhood

assets

Draft Evaluation Criteria

slide-43
SLIDE 43

Best Practice

Improving arterial crossings including crosswalk markings, raised crosswalks, lighting, and signage

  • Provide transportation choices
  • Accommodate access to daily needs and

regional destinations

  • Promote economic opportunity and fiscal

responsibility

  • Promote public health and safety
  • Respect natural and neighborhood assets
  • Maximize benefits through integrated

public investments

Draft Evaluation Criteria

slide-44
SLIDE 44

Best Practice

  • Provide transportation choices
  • Promote economic opportunity and fiscal

responsibility

  • Promote public health and safety
  • Maximize benefits through integrated

public investments

Draft Evaluation Criteria

slide-45
SLIDE 45

Best Practices

  • Promote economic opportunity and fiscal

responsibility

  • Promote public health and safety
  • Respect natural and neighborhood assets
  • Maximize benefits through integrated

public investments

Draft Evaluation Criteria

slide-46
SLIDE 46

Best Practice

  • Provide transportation choices
  • Accommodate access to daily needs and

regional destinations

  • Promote economic opportunity and

fiscal responsibility

  • Promote public health and safety
  • Respect natural and neighborhood

assets

  • Maximize benefits through integrated

public investments

Draft Evaluation Criteria

slide-47
SLIDE 47

Best Practice

  • Provide transportation choices
  • Accommodate access to daily needs

and regional destinations

  • Promote economic opportunity and

fiscal responsibility

  • Promote public health and safety
  • Respect natural and neighborhood

assets

  • Maximize benefits through

integrated public investments

Draft Evaluation Criteria

slide-48
SLIDE 48

Discussion

Project website www.spokaneplanning.org/link.html

Like us on Facebook

www.facebook.com/spokanecity

Follow us on Twitter @SpokaneCity

slide-49
SLIDE 49

Making Spokane a City of Transportation Choices

  • Provide viable transportation
  • ptions for all users
  • Reduce city capital and

maintenance costs

  • Promote health through

active transportation

  • Attract creative industries
  • Reduce household

transportation costs

slide-50
SLIDE 50

Integration

  • “3D view” of streets (above

and below grade)

  • Leverage transportation

investments to meet multiple objectives:

  • stormwater/combined sewer
  • verflow (CSO)
  • economic development/land use
  • transportation
  • Limit disruption to residents

and businesses

slide-51
SLIDE 51

Fixing it First

  • Maintain and enhance
  • ur existing

transportation assets

  • $150 million backlog
  • $40 million annually to

maintain system, but

  • nly $5 million is

funded

  • Leverage internal and

external resources

slide-52
SLIDE 52

Health & Safety

  • Leverage investments to

enhance traffic safety and promote positive public health outcomes

  • “Right-sizing” on

appropriate streets can increase safety and reduce maintenance costs

  • Build active transportation

back into our daily lives

slide-53
SLIDE 53

Livable Streets

  • Match street design to the

function for Spokane districts and neighborhoods

  • Livable streets can be:
  • Safe and convenient for all

users

  • Economically vibrant in

centers and along corridors

  • Multi-purpose and multi-

functional

  • Supportive of neighborhood

quality of life