
SLIDE 1
Background Background
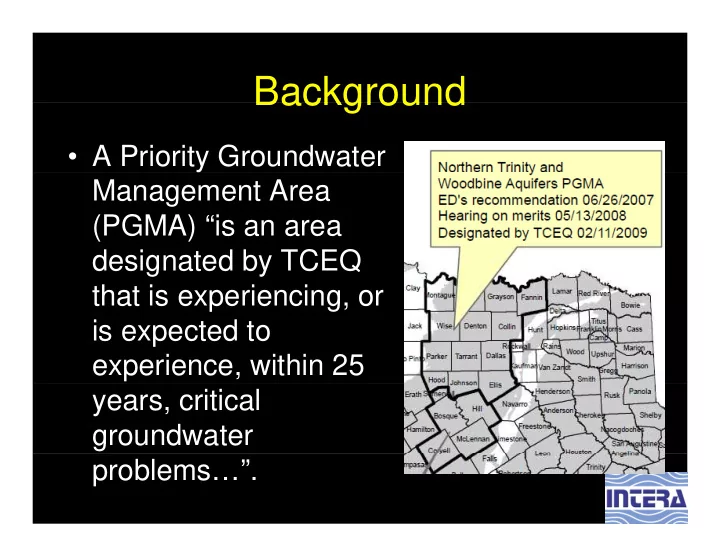
- A Priority Groundwater
Background Background A Priority Groundwater Management Area - - PowerPoint PPT Presentation
Background Background A Priority Groundwater Management Area (PGMA) is an area designated by TCEQ that is experiencing, or is expected to experience, within 25 years, critical groundwater problems. Total water level Total
Well A Well B Drawdown is a function of many things including: y g g
Pump Well A at 40 gpm Drawdown at well A = 44 ft Drawdown at well B 16 ft 24 ft 100 ft 500 ft 1000 ft Drawdown at well B = 16 ft Well A Well B 100 ft 500 ft 1000 ft 19 ft 16 ft
Well A Well B
Drawdown (ft) in Well A Just Well A 44.1 Condition Add Well B 59.3 Add Wells B and C 74.6 Add Wells B, C, and D 88.6
Drainage Area Well D Well C
Well A Well B Well A Well B Well E Well D Well C
r Level Water Sustainable (e.g. Well A) Unsustainable (Well E) Time
Statistic Transmissivity (ft2/day)
Count 48 36 Average 891.3 7.6 Median 832.2 6.1 Minimum 260.4 1.1 Maximum 2 245 8 30 6 Maximum 2,245.8 30.6
Well Screen Diameter Annual Average Flow Rate Screen Length Transmissivity (inches) Flow Rate (gpm) Capacity (gpm) (ft) (ft2/day)
5 inch or less
5 17 4 50 350
5 inch or less
5 17.4 50 350 More than 5 but less than 8 21 40 80 560 8 inch or larger but less than 10 40 80 100 700 10 inch or larger 60 to 100 120 to 200 130 to 150 910 to 150
Distance to 15% drawdown is 750 ft Distance to 10% drawdown % is 1,250 ft