
SLIDE 1
2/4/2018 1
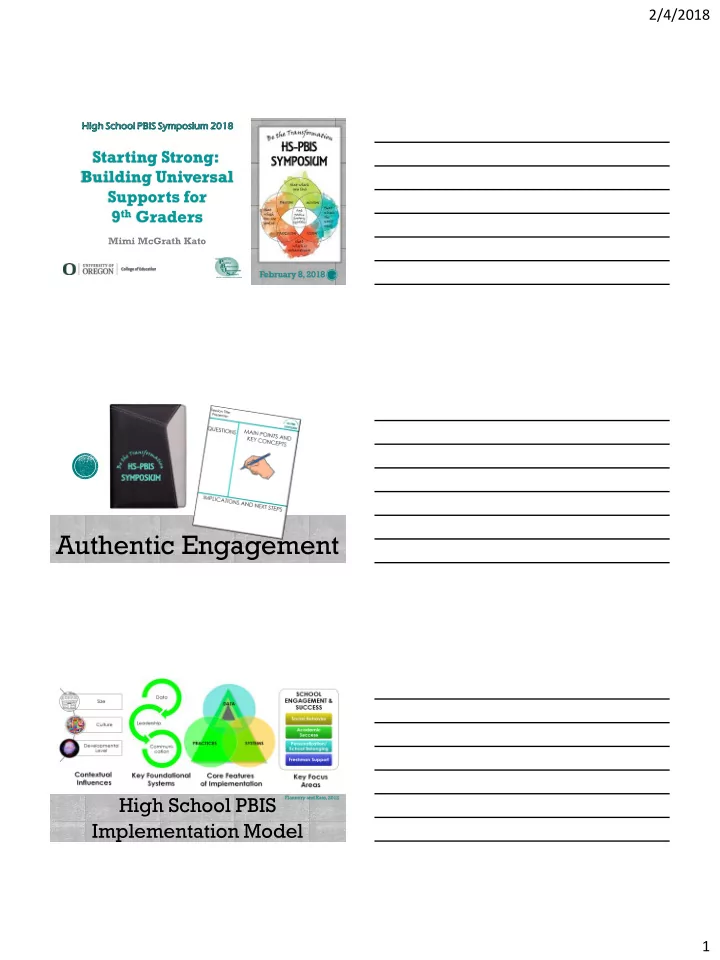
February 8, 2018
Starting Strong: Building Universal Supports for 9th Graders
Mimi McGrath Kato
Authentic Engagement
High School PBIS Implementation Model
Flannery and Kato, 2012
Authentic Engagement High School PBIS Flannery and Kato, 2012 - - PDF document
2/4/2018 Starting Strong: Building Universal Supports for 9 th Graders Mimi McGrath Kato February 8, 2018 Authentic Engagement High School PBIS Flannery and Kato, 2012 Implementation Model 1 2/4/2018 Session Outline Why 4 Key Examples
February 8, 2018
Mimi McGrath Kato
Flannery and Kato, 2012
Why Freshmen? 4 Key Practices Examples
to increase support for 9th graders
9th graders
graders
than in any other grade.
year.
in high schools across the country dramatically outnumber those of students in the upper grades.
that a student will drop out than any other 8th grade predictor, including test scores, other indicators of academic achievement, and age.
that of student who are able to stay on track during the 9th grade year.
Why Freshmen: FACT or FICTION???
than in any other grade. FICTION – 3-5 TIMES MORE LIKELY
their 8th grade class were found to be off track by the end of their 9th grade year. FICTION – 25% OF HIGH ACHIEVING STUDENTS
high schools across the country dramatically outnumber those of students in the upper grades. FACT
that a student will drop out than any other 8th grade predictor, including test scores, other indicators of academic achievement, and age. FACT
that of student who are able to stay on track during the 9th grade year. FICTION – 59% LOWER GRAD RATE IF OFF TRACK AS FRESHMEN
1. Southern Regional Educational Board. (2002). Opening doors to the future: Preparing low achieving middle grade students to succeed in high school. Atlanta, GA: Author. 2. Allensworth, E. M., & Easton, J. Q. (2005). The on-track indicator as a predictor of high school graduation. Chicago, IL: Consortium on Chicago School Research. Retrieved from www.consortium-chicago.org/publications/p78.html 3. Flannery, K. B., Fenning, P., McGrath Kato, M., & Bohanon, H. (2013). A descriptive study of
138-149. doi: 10.1177/1063426611419512 4. Jerald, C. D. (2006). Dropping out is hard to do: Issue Brief. Center for Comprehensive School Reform and Improvement. Washington, DC. Retrieved from www.cenerforsci.org/files/CenterIssueBriefJune06.pdf 5. Allensworth, E. M., & Easton, J. Q. (2007). What matters for staying on track and graduating in Chicago Public High Schools. Chicago, IL: Consortium on Chicago School
Connection to school
Understand key knowledge and skills Positive relationships with teachers and staff Positive relationships with
The fundamental purpose of PBIS is to make schools more effective, efficient & equitable learning environments.
– PREDICTABLE – CONSISTENT – POSITIVE – SAFE 9
10 11 12
6 Features
Leadership Team Data & Decision System Consequences Acknowledge- ments Expectations Classroom Systems
6 Features
Freshmen Supports
~80% of Students ~15% ~5%
Monitor Data Increase Consistency Teach Provide Peer Support
2016-17 Freshmen Class: ABCs
76% of Freshmen had 90% or better attendance in 8th Grade 26% of Freshmen had 2 or more Majors when they were in 8th Grade 83% of Freshmen had 2.0 or higher GPA as 8th graders
Attendance
76 6
0% 10% 20% 30% 40% 50% 60% 70% 3.0 or Above 2.0 - 2.9 Below 2.0
% Students on F List by GPA
0% 10% 20% 30% 40% 50% 60% 70% 90% or Above 80-89% Below 80%
% Students on F List by Attendance
24.50% 75.50%
Freshmen On Track: Credits Students with at least 3 Credits at Semester (N=341 Students) Students Off Track Students OnTrack
0% 10% 20% 30% 40% 50% 60% 70% 80% 1-1.5 2-2.5 3 3.5 4 >4 % of Freshmen Students (N-341) Credits
% Students by # Credits Earned v. Attempted
Credits Attempted Credits Earned
FLT language
attendance
graduation Student & family language
“fewer than 5”)
“A student who is just 10 minutes late each day misses 30 hours
student who is absent from school 1½ days each month on average from kindergarten through high school loses a YEAR of education.”
Monitor Data Increase Consistency Teach Provide Peer Support
Developing an effective systems approach Common Vision & Values Common Language Common Experience
Predictable, Positive Environment
practices to support student learning
Examples include:
during passing periods
door
Monitor Data Increase Consistency Teach Provide Peer Support
SCHOOL ENGAGEMENT SELF-DIRECTED LEARNERS!
BEHAVIORAL COGNITIVE EMOTIONAL
extracurricular)
effort
School Engagement Self-Directed Learners Behavioral: Getting Work Done
Cognitive: Getting to Graduation
Emotional: Getting Connected
Define Teach Reinforce
generate a list….
What knowledge and skills are essential for your freshmen to know and be able to do?
REMEMBER: The smallest change to yield the biggest impact!
Monitor Data Increase Consistency Teach Provide Peer Support
Russell & Bakken, 2002).
peers (Dennison, 2000; Karcher, 2005).
development; these peers understand the rules and develop positive strategies to overcome issues or problems (DuBois, Holloway, Valentine & Cooper, 2002;
Gensemer, 2000; Karcher, Nakkula, & Harris, 2005).
Selection & Placement Training Roles & Responsi- bilities Ongoing support
school’
–Coach and model
– Behavioral Engagement (academic enablers and school rules) – Cognitive Engagement (motivation, work tasks, self- regulation) – Emotional Engagement (school belonging, connection to and support by peers and teachers)
Curriculum Delivery Student Check Ins Positive Social Role Model
– How does your high school utilize student leaders? – What existing groups of upperclassmen leaders could be trained to provide 9th grade support?
Lucky Sustaining
Positive outcomes, low understanding of how they were achieved Replication of success is unlikely Positive outcomes, high understanding of how they were achieved Replication of success likely
Losing Ground Learning
Undesired outcomes, low understanding of how they were achieved Replication of failure likely Undesired outcomes, high understanding of how they were achieved Replication of mistakes unlikely Fidelity Outcomes
Monitoring Fidelity and Outcomes Related to Freshmen Expectations
do?
We have to know the answer to this question BEFORE we can ask if it worked! – Initial Teaching – Agreements – Acknowledgements
– Freshmen Expectations Knowledge & Skills – ABC’s
1 2 3 4 5 6 7 8 9 10 11 12 13 14 15 L K J I H G F E D C B A
Average Score by Teacher
Show me the Data! Exemplar Freshmen Outcomes
Indicator 15-16 Goal 15-16 Year End 16-17 Goal 16-17 Year End GPA
2.5 2.49 2.5 2.6
Honor Roll
25% 18% 25% 28%
On Track (6+ Credits)
85% 72% 80% 81%
Attendance
92% 86% 90% 93%
Indicator 16-17 Goal 16-17 Year End GPA above 2.5
70% 70%
On Track (6+ Credits)
85% 86%
Attendance 90%
90% 75% (overall was 92%)
Monitor Data Increase Consistency Teach Provide Peer Support
effect
also defining what you will stop doing to make the addition possible
monitoring fidelity and outcomes
Mimi McGrath Kato mmkato@uoregon.edu Brigid Flannery, Danielle Triplett, Angus Kittelman
The development of this presentation was supported in part by a grant from Institute of Education Sciences, U.S. Department of Education (#R305A150010). Opinions expressed herein are the authors’ and do not reflect necessarily the position of the U.S. Department of Education, and such endorsements should not be inferred.