
SLIDE 1
ATLAS BEAMLINE TUNING AND CHARACTERIZATION
d r h g f d j h n g n g f m h g m g h m g h j m g h f m fRAHEEM BARNETT
- Aug. 2016
ATLAS BEAMLINE TUNING AND CHARACTERIZATION d r h g f d j h n g - - PowerPoint PPT Presentation
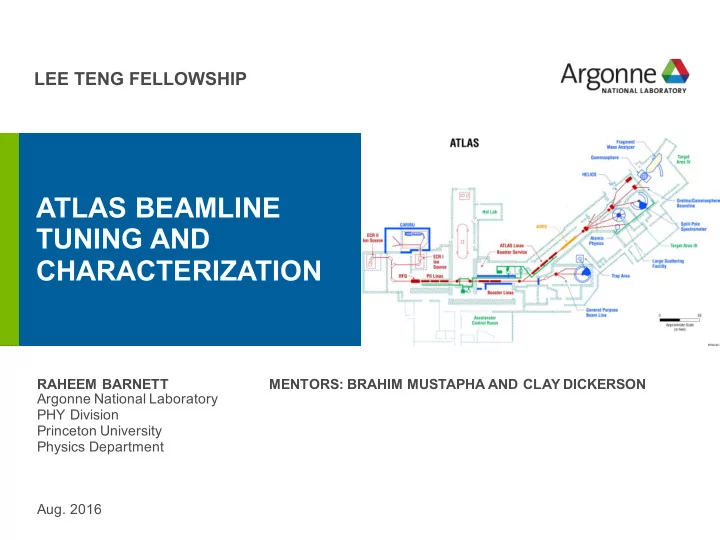
LEE TENG FELLOWSHIP ATLAS BEAMLINE TUNING AND CHARACTERIZATION d r h g f d j h n g n g f m h g m g h m g h j m g h f m f RAHEEM BARNETT MENTORS: BRAHIM MUSTAPHA AND CLAY DICKERSON Argonne National Laboratory PHY Division
3
4
6
8
9
10
12
13
14
15
16
17
19