SLIDE 17 Introduction and motivation Time-Independent Trace Format Trace Acquisition Process Trace Replay with SimGrid Experimental Evaluation Conclusion and Evaluation of the Acquisition Modes
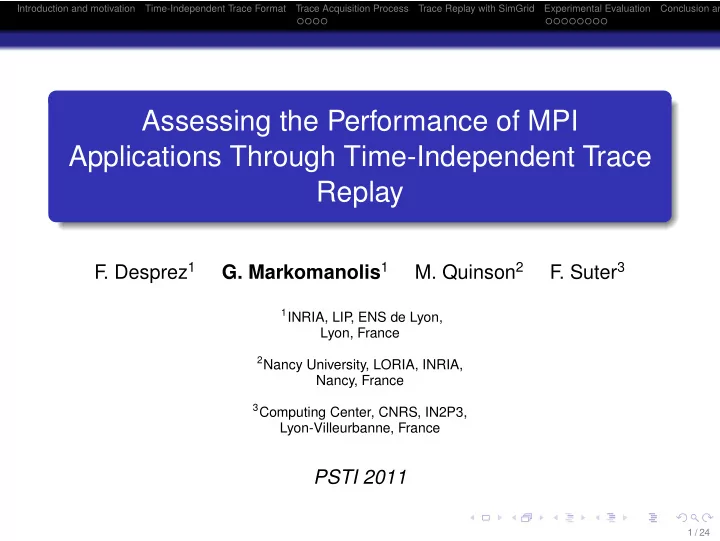
Evolution of the execution time
Evolution of the execution time of instrumented class B instance of EP , LU executed by 64 processes and 43 ones for DT with regard to the acquisition mode
Acquisition mode R F-2 F-4 F-8 F-16 F-32 S-2 SF-(2,2) SF-(2,4) SF-(2,8) SF-(2,16) Number of nodes 64 32 16 8 4 2 (32,32) (16,16) (8,8) (4,4) (2,2) LU Execution Time (in sec.) 20.73 52.96 88.66 179.07 347.27 689.18 37.54 79.19 134.05 277.25 505.64 Ratio to regular mode 1 2.55 4.28 8.64 16.75 33.25 1.81 3.82 6.47 13.37 24.39 EP Execution Time (in sec.) 1.99 4.06 8.33 16.29 36.42 69.05 2.67 5.38 10.77 21.52 43.09 Ratio to regular mode 1 2.04 4.18 8.18 18.3 34.7 1.34 2.7 5.41 10.81 21.65 Acquisition mode R F-2.625 F-5.25 F-10.5 F-21 S-2 SF-(2,2.625) SF-(2,5.25) SF-(2,10.5) SF-(2,21) Number of nodes 43 16 8 4 2 (22,21) (8,8) (4,4) (2,2) (1,1) DT Execution Time (in sec.) 4.56 12.62 18.67 32.2 58.8 10.66 31.277 41.06 47.49 66.93 Ratio to regular mode 1 2.76 4.09 7.06 12.89 2.33 6.86 9 10.4 14.67
Linear increase with folding factor for EP and LU A trace tool produces traces with erroneous timestamps Same simulated time for all the acquisition modes with variations less than 1%
17 / 24