
SLIDE 1
Assessing Early Retirement of Coal Generation Patrick Barkey, Bureau - - PowerPoint PPT Presentation
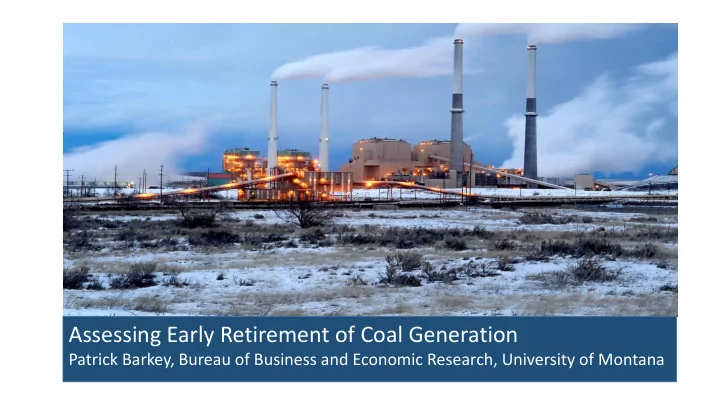
Assessing Early Retirement of Coal Generation Patrick Barkey, Bureau of Business and Economic Research, University of Montana The Colstrip Steam Electric 532 workers Station Today $77.4 mill. payroll $187 mill. of coal purchased $25 mill.
4.9% 8.9% 45.8% 39.2% 1.2% 31.3% 23.8% 30.4% 10.4% 4.0% 23.6% 25.6% 31.2% 15.9% 3.7%
White American Indian Other Hispanic or Latino
$50,000 to $100,000 $100,000 to $200,000 Colstrip Rest of County Montana Less than $25,000 $25,000 to $50,000
Source: 2017 American Community Survey 5-year Estimates
Colstrip Rest of County Montana Colstrip Rest of County Montana Colstrip Rest of County Montana Colstrip Rest of County Montana More than $200,000
1 2 3 4 5 6 7
1980 1990 2000 2010 Thousands
10 20 30 40 50 60 70 80 90 100
Rosebud County
Source: U.S. Bureau of Economic Analysis
5 10 15 20 25 30 35 Net Generation Total Retail Sales
Million Mwh
16.1 Million Mwh Exports = 47%
5,000,000 10,000,000 15,000,000 20,000,000 25,000,000 30,000,000 35,000,000 1990 1991 1992 1993 1994 1995 1996 1997 1998 1999 2000 2001 2002 2003 2004 2005 2006 2007 2008 2009 2010 2011 2012 2013 2014
MWH
Source: U.S. Energy Information Administration Generation Consumption Exports
5 10 15 20 25 30 35 Million Mwh Coal Hydroelectric Conventional Natural Gas Other Other Gases Petroleum Wind Wood and Wood Derived Fuels
Coal, 53.7% Hydroelectric Conventional, 34.8% Natural Gas, 2.2% Other, 1.2% Other Gases, 0.0% Petroleum, 1.7% Wind, 6.3% Wood and Wood Derived Fuels, 0.0% Source: U.S. Energy Information Administration
supports $77.4 million payroll, purchases $187 million in coal annually
adjacent Rosebud mine owned by Westermoreland Coal Company
with 307 MW capacity each, and Units 3 and 4, completed in the 1980s, with 740 MW of capacity each
100 200 300 400 500 600 700 800
Unit 1 Unit 2 Unit 3 Unit 4
Talen PSE PGE Avista PacifiCorp NorthWestern
1,000
2025 2026 2027 2028 2029 2030 2031 2032 2033 2034 2035 2036 2037 2038 2039 2040 2041 2042 2043
The Economic Impact of Early Retirement of Colstrip Units 3 and 4 Employment Compared to No Retirement Baseline
Jobs
Maximum Difference from Baseline = 3,752 jobs
*Full period impacts for employment and population are averages of the annual impacts, 2028-43. Full period impact for income, output and revenues are the sum of the annual impacts.
Mining, -300 Construction, -337 Manufacturing, -21 Wholesale Trade, -24 Retail Trade, -336 Transportation and Warehousing, -25 Professional and Technical Services, -51 Utilities, -415 Health Care and Social Assistance, - 159 Arts, Entertainment, and Recreation, -15 Accommodation and Food Services, -194 Other Services, except Public Administration,
Other Private, -110 State and Local Government, -1211
The Economic Impact of Early Retirement of Colstrip Units 3 and 4 Employment Impacts by Industry, 2028-43 Average