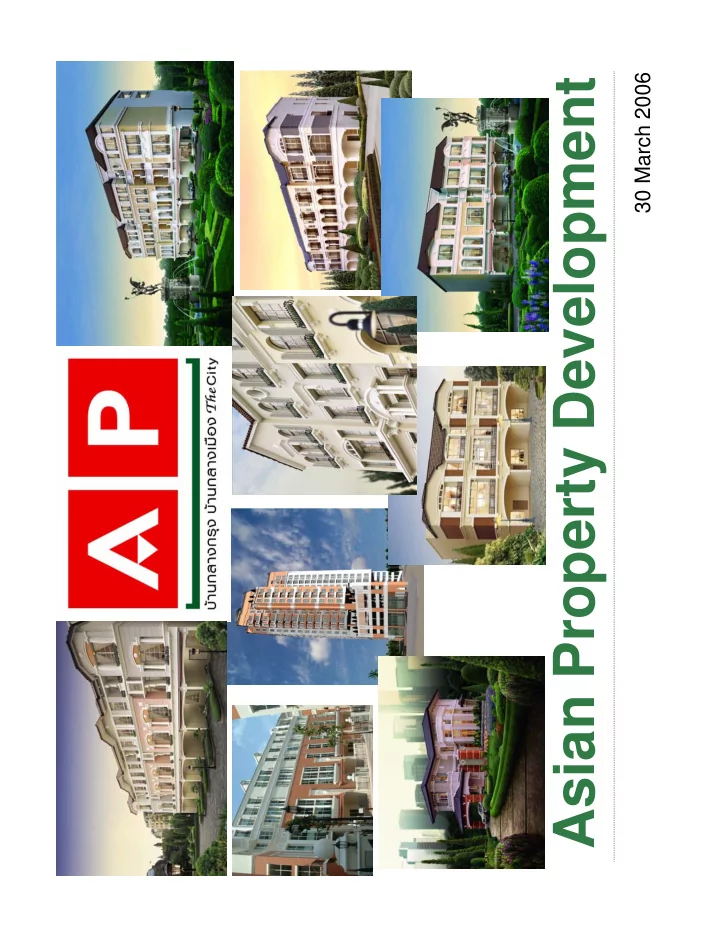

30 March 2006 Asian Property Development
Ongoing Projects (as of Mar 15, 2006) Project Completion % sold (in unit) Available No of value (last unit (as of Mar 15, for sales Type Rai units (Btm) Launch year transferred) 2006) (Btm) Place & Park SDH 91.6 275 800 N/A 800 The City (Rama 5 - Pinklao) SDH 90.0 258 1,700 Q3 2004 Q4 2007 50% 843 The City (Pinklao) SDH 38.0 88 700 Q3 2004 Q4 2007 65% 246 Baan Klang Muang (British Town Srinakarin) TH 43.5 413 1,630 Q1 2005 Q4 2007 57% 695 Baan Klang Krung (Siam - Patumwan) Condo 4.7 580 2,700 Q1 2005 Q4 2007 96% 98 Baan Klang Muang (The Paris Ratchavibha) TH 17.0 137 737 Q2 2005 Q4 2006 98% 16 Sydney Office Park (Ladprao 71) TH 11.5 76 669 Q4 2005 Q3 2006 88% 79 Baan Klang Muang (Grand De Paris Ratchada) TH 18.0 209 870 Q4 2005 Q4 2006 59% 354 Baan Klang Krung (Grande Vienna Rama III) TH 18.2 205 1,420 Q4 2005 Q4 2006 84% 222 Baan Klang Krung (Grande Vienna Rama III) SDH 13.1 24 500 Q4 2005 Q4 2007 17% 417 Baan Klang Muang (Luzern On-nut 46) TH 26.1 299 880 Q4 2005 Q2 2007 22% 683 Baan Klang Muang (Monte-carlo Ratchavibha) TH 26.9 261 1,273 Q1 2006 Q4 2007 25% 951 Klang Krung Office Park (San Francisco Bangna) TH 19.0 110 1,040 Q1 2006 Q3 2007 45% 567 5,971 Note: 1 rai = 0.4 acre = 0.16 hectare = 400 sq.w. = 1,600 sq.m., 1 sq.feet = 0.09 sq.m. , 1 sq.m. = 10.76 sq. feet SDH = Single Detached Houses, TH = Townhouses Source: Asian Property Development
Future Projects to be launched in 2006 Project Completion No of value Land (last unit Type Rai units (Btm) acquisition Launch year transferred) Baan Klang Krung (The Nice Ratchavibha) SDH 18.2 50 670 Q1 2004 Q2 2006 Q3 2007 Baan Klang Krung (Ratchayotin) TH 18.0 197 850 Q3 2005 Q3 2006 Q4 2007 Baan Klang Krung (Ratchayotin) SDH 20.0 40 650 Q3 2005 Q3 2006 Q4 2007 Baan Klang Krung (Siam - Patumwan) II Condo 1.6 224 1,100 Q4 2005 Q3 2006 Q4 2008 Baan Klang Muang (Srinakarin - Anamai) TH 24.7 238 800 Q4 2005 Q4 2006 Q1 2008 Baan Klang Muang (Kaset Navamin) TH 31.2 320 990 Q4 2005 Q4 2006 Q4 2008 Baan Klang Muang (Krungthep Kreeta) 1 TH 19.1 299 740 Q4 2005 Q4 2006 Q1 2008 Baan Klang Muang (Krungthep Kreeta) 2 TH 10.9 113 310 Q1 2006 Q4 2006 Q1 2008 Total planned-to-be-launched projects 143.7 1,481 6,110 Note: 1 rai = 0.4 acre = 0.16 hectare = 400 sq.w. = 1,600 sq.m., 1 sq.feet = 0.09 sq.m. , 1 sq.m. = 10.76 sq. feet SDH = Single Detached Houses, TH = Townhouses Source: Asian Property Development
AP’s Project Portfolio Condominium 10% Single Detached Houses (SDH) 24% Townhouse 66% Source: Asian Property Development
Summary of Projects (million Baht) (as of Mar 15, 2006) Sales backlog as of Dec 2005 4,940 - Recognise in 2006 2,340 - Recognise (from Condo) in 2007 2,600 Additional sales backlog (1 1,420 Jan - 1 5 M ar 2006) Total sales backlog to be recognised 6,360 Backlog to be recognised as income in 2006 3,760 Backlog to be recognised as income in 2007 2,600 Source: Asian Property Development
Financial Summary 2005 Q4 2005 Q3 2005 Q2 2005 Q1 2005 2004 2003 2002 Revenues from Property Development (Btm) 4,490 1,499 1,174 1,092 725 4,793 4,312 2,408 YoY Chg (%) -6.3% -25.9% -8.2% 11.0% 43.1% 11.2% 79.0% 128.9% Consolidated Revenues (Btm) 5,258 1,499 1,363 1,353 1,043 5,740 4,757 2,701 YoY Chg (%) -8.4% -35.7% -0.1% 3.2% 42.3% 20.7% 76.1% 110.8% QoQ Chg (%) 10.0% 0.7% 29.8% -55.3% Gross profit from Property Development (Btm) 1,551 491 393 412 254 1,821 1,674 899 Gross margin from Property (%) 34.5% 32.8% 33.5% 37.7% 35.1% 38.0% 38.8% 37.3% Overall Gross profit (Btm) 1,683 491 435 448 309 2,004 1,771 993 Gross margin (%) 32.0% 32.8% 31.9% 33.1% 29.7% 34.9% 37.2% 36.8% Operating profit (Btm) 976 291 258 251 176 1,369 1,441 745 Operating margin (%) 18.6% 19.4% 18.9% 18.6% 16.9% 23.9% 30.3% 27.6% Net profit (Btm) 765 243 207 167 148 1,097 1,192 688 YoY Chg (%) -30.3% -46.7% -28.0% -20.8% 3.3% -7.9% 73.2% 160.0% QoQ Chg (%) 17.2% 23.9% 12.4% -67.4% EPS (Bt) 0.34 0.11 0.09 0.07 0.07 0.48 0.53 0.34 Total assets (Btm) 10,291 10,291 9,266 9,570 9,900 9,247 6,620 3,586 Equity (Btm) 3,983 3,983 3,824 3,708 4,259 4,266 3,325 1,706 Outstanding debt (Btm) 5,303 5,303 4,530 4,755 4,584 4,030 2,471 1,464 Net debt (Btm) 4,787 4,787 4,163 4,347 3,965 3,322 1,507 1,108 Net debt to equity (x) 1.20 1.20 1.09 1.17 0.93 0.78 0.45 0.65 ROE (%) (average equity) 18.5% N/A N/A N/A N/A 28.9% 47.4% 52.2% Source: Asian Property Development
Recommend
More recommend