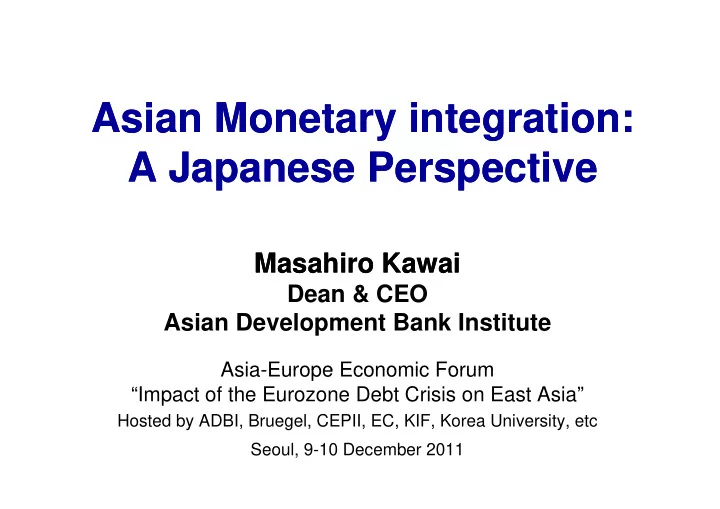
asian monetary integration asian monetary integration y y
play

Asian Monetary integration: Asian Monetary integration: y y g g - PowerPoint PPT Presentation

Asian Monetary integration: Asian Monetary integration: y y g g A Japanese Perspective A Japanese Perspective M Masahiro Kawai Masahiro Kawai M hi hi K K i i Dean & CEO Asian Development Bank Institute Asia-Europe Economic


  1. Asian Monetary integration: Asian Monetary integration: y y g g A Japanese Perspective A Japanese Perspective M Masahiro Kawai Masahiro Kawai M hi hi K K i i Dean & CEO Asian Development Bank Institute Asia-Europe Economic Forum Asia Europe Economic Forum “Impact of the Eurozone Debt Crisis on East Asia” Hosted by ADBI, Bruegel, CEPII, EC, KIF, Korea University, etc y , g , , , , y, Seoul, 9-10 December 2011

  2. Outline Outline Outline Outline 1 Introduction 1. 1. Introduction Introduction Introduction 2. 2. Impact of the Global Financial 2. 2. Impact of the Global Financial Impact of the Global Financial Impact of the Global Financial Crisis on Japan Crisis on Japan 3. 3. Japan’s Exchange Rate Policy Japan’s Exchange Rate Policy 4 Japan’s Strategy for Regional 4. 4. Japan s Strategy for Regional Japan’s Strategy for Regional Japan s Strategy for Regional Monetary Integration Monetary Integration 5. 5. Conclusion Conclusion

  3. 1. Introduction 1. Introduction Is there a case for regional exchange rate policy coordination in Asia? rate policy coordination in Asia? • The Asian financial crisis (1997-98) highlighted the value of regional monetary & financial the value of regional monetary & financial cooperation: CMI, ERPD, ABMI, EMEAP • Common shocks from the global capital markets Common shocks from the global capital markets (GFC, US QE2 and possible QE3, the eurozone sovereign debt and banking crisis) affect many economies in the region economies in the region • Rising regional economic inter-dependence in Asia suggests a case for monetary integration Asia suggests a case for monetary integration • What are the lessons from the euro crisis for Asian monetary integration? Asian monetary integration? • What is Japan’s strategy?

  4. 2. Impact of the Global 2. Impact of the Global Financial Crisis on Japan Financial Crisis on Japan • Real sector impact • Impact on the yen • Impact of yen appreciation Impact of yen appreciation on the Japanese economy

  5. (1) Real Sector Impact (1) Real Sector Impact • The global financial crisis (GFC) adversely affected Japan’s exports, imports, industrial affected Japan s exports, imports, industrial production and real GDP - Japan had negative growth in 2008 - Japan’s exports were affected both in finished products for the US & EU markets and parts and components for the EEA markets p • These impacts were largely similar across East Asia • The triple disasters due to the 3.11 earthquake, tsunami and nuclear plant failures affected the economy significantly affected the economy significantly • The economy continued to shrink until 2011Q2; there was a rebound in 2011Q3 and recovery there was a rebound in 2011Q3 and recovery expected in 2012Q4 and in 2012.

  6. Japan’s exports plunged, then rebounded Japan’s exports plunged, then rebounded Export Growth in Japan and emerging East Asia (in %) 60 60 40 20 0 ‐ 20 ‐ 40 ‐ 60 Jan ‐ Apr ‐ Jul ‐ Oct ‐ Jan ‐ Apr ‐ Jul ‐ Oct ‐ Jan ‐ Apr ‐ Jul ‐ Oct ‐ Jan ‐ Apr ‐ Jul ‐ Oct ‐ Jan ‐ Apr ‐ 06 06 06 06 07 07 07 07 08 08 08 08 09 09 09 09 10 10 PRC Japan NIEs ASEAN 5 Source : CEIC database

  7. Japan exports by sector: Japan exports by sector: A t A t Autos hardest hit, but now rebounding Autos hardest hit, but now rebounding h h d d t hit b t t hit b t b b di di Y/y% change Yen-value Y/y% change, Yen value 80 80 60 60 40 40 20 20 0 0 -20 -20 -40 -40 -60 -60 -80 -80 06 07 08 09 10 11 General machinery G l hi El Electrical machinery t i l hi T Transport equipment t i t A t Autos Source : CEIC Database Co.

  8. Japan import growth remained firm, Japan import growth remained firm, except from Taipei,China except from Taipei,China Y/y% change, US$ value 60 60 40 40 20 20 20 20 0 0 -20 -20 -40 -40 06 07 08 09 10 11 Total Korea PRC Taipei,China Source : CEIC Database Co.

  9. Japanese economy contracted sharply Japanese economy contracted sharply due to the global financial crisis due to the global financial crisis due to the global financial crisis due to the global financial crisis 15 10 5 5 0 -5 -10 Real GDP growth rate (year-over-year) -15 5Q1 Q2 Q3 Q4 6Q1 Q2 Q3 Q4 7Q1 Q2 Q3 Q4 8Q1 Q2 Q3 Q4 9Q1 Q2 Q3 Q4 0Q1 Q2 Q3 Q4 1Q1 Q2 2005 2006 2007 2008 2009 2010 2011 USA EU Japan China India India Asian NIEs Asian NIEs Asean 5 Asean 5 Source : IMF, International Financial Statistics , CD-ROM; Eurostat

  10. GDP rebounded in 2011Q3 GDP rebounded in 2011Q3 GDP growth (y-o-y, %) Contrib. to Real GDP, Y/y Pctg. Pts. 6 6 4 4 4 4 2 2 0 0 -2 -2 -4 -4 -6 -6 -8 -8 -10 -10 06 07 08 09 10 11 Consumption C ti P i Priv. cap. expend. d N t E Net Exports t GDP GDP Source : Cabinet Office

  11. Japan’s economic growth forecasts Japan’s economic growth forecasts Consensus forecasts for Japan real GDP (% change) 2011 2012 Median Median -0 4 0.4 2 8 2.8 Mean -0.5 2.8 Capital Economics -0.2 2.5 Daiwa Institute of Research -0.7 2.5 UBS -0.4 2.9 CITIC Group -0.2 2.4 Nomura Securities -0.3 3.1 JPMorgan Chase 0.0 -- Morgan Stanley -1.2 2.9 BNP Paribas -0.8 2.1 C Credit Agricole dit A i l -0.7 0 7 2 9 2.9 Itochu Corp -0.3 2.8 Japan Research Institute -0.9 3.3 Mitsubishi Research Institute Mitsubishi Research Institute -0.4 0 4 2 4 2.4 Mitsubishi UFJ Research and Consulting -0.8 3.4 Reference IMF IMF -0 7 0.7 2 9 2.9 OECD -0.9 2.2 Source: Bloomberg accessed on 9 September 2011, IMF (2011), OECD (2011)

  12. (2) Impact on the yen (2) Impact on the yen • The global financial crisis (GFC) caused the yen to appreciate, rather than depreciate, unlike in many other economies - Massive repatriation of the US dollar back to the US markets driven by cash-short US financial firms markets, driven by cash-short US financial firms - Korea saw rapid capital outflows and a mini won crisis - Japan’s yen appreciation partly due to the unwinding p y pp p y g of carry trades • Following the triple disasters , the yen began to appreciate with the expectation of Japanese appreciate with the expectation of Japanese insurance firms’ repatriation back home • The nominal value of the yen continued to The nominal value of the yen continued to appreciate, breaking the historical record reached in April 1995 - Monthly average rate: 76.84 yen/$ (Sep. 2011) vs. 83.67 yen/$ (April 1995)

  13. Why yen appreciation? Despite the aging pressure and rising public debt, the yen remains strong • One fundamental reason is price deflation in Japan, that sets the long-term trend of nominal yen rates yen rates • Another reason is persistent current account surpluses surpluses • The third reason is a safe haven effect; The Japanese economy is not growing, but its Japa ese eco o y s ot g o g, but ts growth prospect is better than those of the US and Europe given the latter’s problems - Sovereign debt and banking crisis in the eurozone S i d bt d b ki i i i th - Rising public debt, high unemployment, uncertain property prices, and potential for QE3 property prices, and potential for QE3

  14. Nominal yen appreciation driven partly Nominal yen appreciation driven partly by Japan’s price deflation by Japan’s price deflation by Japan’s price deflation by Japan’s price deflation 350 350 Yen/US$ Yen/US$ 325 300 275 250 225 225 200 175 150 125 100 75 1970 1975 1980 1985 1990 1995 2000 2005 2010 Nominal Rate N i l R PPI R PPI Ratio i CPI R CPI Ratio i Source: International Monetary Fund, International Financial Statistics , CD-ROM

  15. Japan's current account is still in surplus Japan's current account is still in surplus p p p p 5 (% of GDP) (% of GDP) 4 3 3 2 1 0 -1 -2 2 1980 1985 1990 1995 2000 2005 2010 Current Account Goods Trade Balance Sevices Trade Balance S i T d B l I Income Balance B l Source : IMF, International Financial Statistics , CD-ROM

  16. (3) Impact of yen appreciation on (3) Impact of yen appreciation on th th the Japanese economy the Japanese economy J J • The yen’s overall real effective exchange rate (BIS y g ( REER), based on relative CPIs, is still about 30% lower than in the previous peak in 1995 • But the REER for the automobile sector suggests that the level is about the same as the 1995 level - Large negative spillover effects on the auto-related L ti ill ff t th t l t d sectors (steel, tires, glass, electronics, etc) • Business concern over the hollowing-out of • Business concern over the hollowing-out of Japanese manufacturing - Sectors which have exited Japan are less affected p - Competitive sectors, like automobiles and technology & knowledge intensive sectors, are now severely affected - Some evidence of a shift towards nontradables

  17. Real effective exchange rates of the yen, Real effective exchange rates of the yen, BIS d t BIS d t BIS data and for automobiles BIS data and for automobiles d f d f t t bil bil 150 2005 2005 2005 = 100 2005 = 100 100 100 140 130 30 120 110 110 100 90 90 80 70 70 60 1980 1985 1990 1995 2000 2005 2010 BIS Automobiles (US & Korea) Automobiles (US, Korea & Germany)

Download Presentation
Download Policy: The content available on the website is offered to you 'AS IS' for your personal information and use only. It cannot be commercialized, licensed, or distributed on other websites without prior consent from the author. To download a presentation, simply click this link. If you encounter any difficulties during the download process, it's possible that the publisher has removed the file from their server.

Recommend


More recommend