
SLIDE 1
10/10/2018 1
1Department of Forensic Medicine, Yonsei University College of Medicine, Seoul, Korea 2Department of Forensic Medicine and Brain Korea 21 PLUS Project for Medical Science, Yonsei University, Seoul, Korea
Sae Rom Hong1,2, Sang-Eun Jung1, Eun Hee Lee1, Kyoung-Jin Shin1,2, Woo Ick Yang1, Hwan Young Lee1,*
Application and Comparison of Methylation Snapshot and MPS Methods to Analyze Epigenetic Age Signatures in Saliva
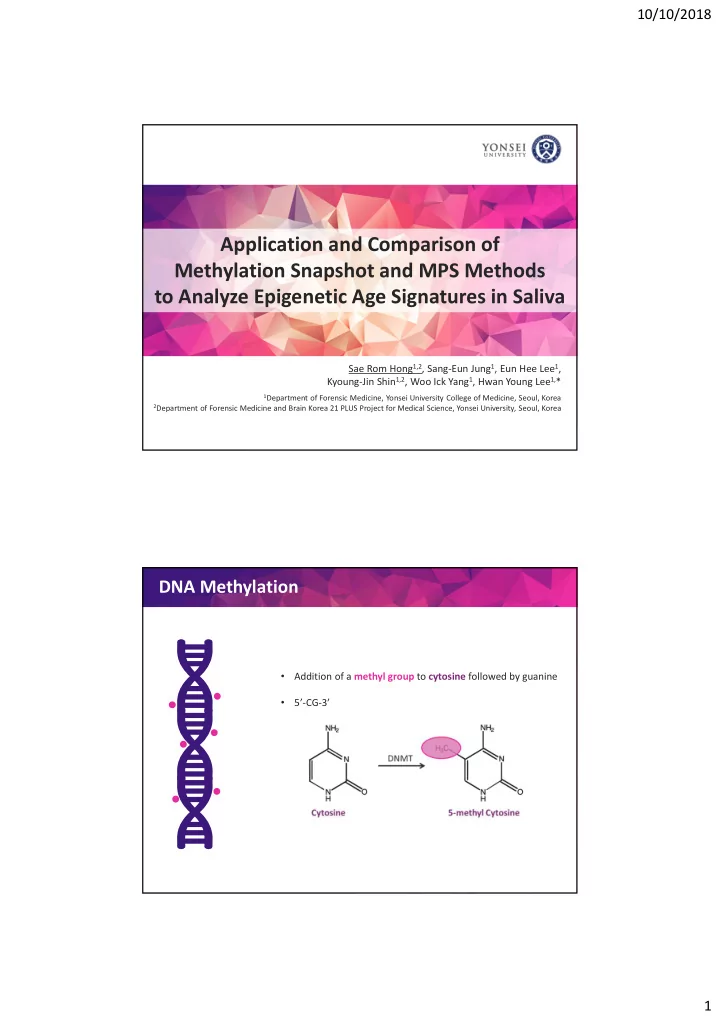
DNA Methylation
- Addition of a methyl group to cytosine followed by guanine
- 5’-CG-3’