
APPENDIX
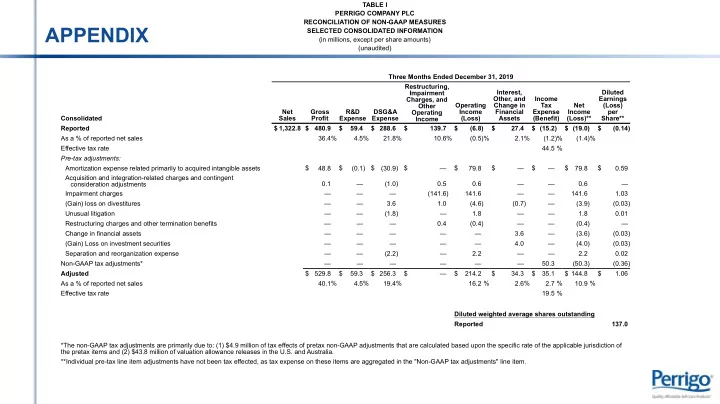
TABLE I PERRIGO COMPANY PLC RECONCILIATION OF NON-GAAP MEASURES SELECTED CONSOLIDATED INFORMATION (in millions, except per share amounts) (unaudited) Three Months Ended December 31, 2019 Consolidated Net Sales Gross Profit R&D Expense DSG&A Expense Restructuring, Impairment Charges, and Other Operating Income Operating Income (Loss) Interest, Other, and Change in Financial Assets Income Tax Expense (Benefit) Net Income (Loss)** Diluted Earnings (Loss) per Share** Reported $ 1,322.8 $ 480.9 $ 59.4 $ 288.6 $ 139.7 $ (6.8) $ 27.4 $ (15.2) $ (19.0) $ (0.14) As a % of reported net sales 36.4% 4.5% 21.8% 10.6% (0.5)% 2.1% (1.2)% (1.4)% Effective tax rate 44.5 % Pre-tax adjustments: Amortization expense related primarily to acquired intangible assets $ — $ 48.8 $ (0.1) $ (30.9) $ — $ 79.8 $ — $ — $ 79.8 $ 0.59 Acquisition and integration-related charges and contingent consideration adjustments — 0.1 — (1.0) 0.5 0.6 — — 0.6 — Impairment charges — — — — (141.6) 141.6 — — 141.6 1.03 (Gain) loss on divestitures — — — 3.6 1.0 (4.6) (0.7) — (3.9) (0.03) Unusual litigation — — — (1.8) — 1.8 — — 1.8 0.01 Restructuring charges and other termination benefits — — — — 0.4 (0.4) — — (0.4) — Change in financial assets — — — — — — 3.6 — (3.6) (0.03) (Gain) Loss on investment securities — — — — — — 4.0 — (4.0) (0.03) Separation and reorganization expense — — — (2.2) — 2.2 — — 2.2 0.02 Non-GAAP tax adjustments* — — — — — — — 50.3 (50.3) (0.36) Adjusted $ 1,322.8 $ 529.8 $ 59.3 $ 256.3 $ — $ 214.2 $ 34.3 $ 35.1 $ 144.8 $ 1.06 As a % of reported net sales 40.1% 4.5% 19.4% 16.2 % 2.6% 2.7 % 10.9 % Effective tax rate 19.5 % Diluted weighted average shares outstanding Reported 137.0 *The non-GAAP tax adjustments are primarily due to: (1) $4.9 million of tax effects of pretax non-GAAP adjustments that are calculated based upon the specific rate of the applicable jurisdiction of the pretax items and (2) $43.8 million of valuation allowance releases in the U.S. and Australia. **Individual pre-tax line item adjustments have not been tax effected, as tax expense on these items are aggregated in the "Non-GAAP tax adjustments" line item.