
SLIDE 1
1
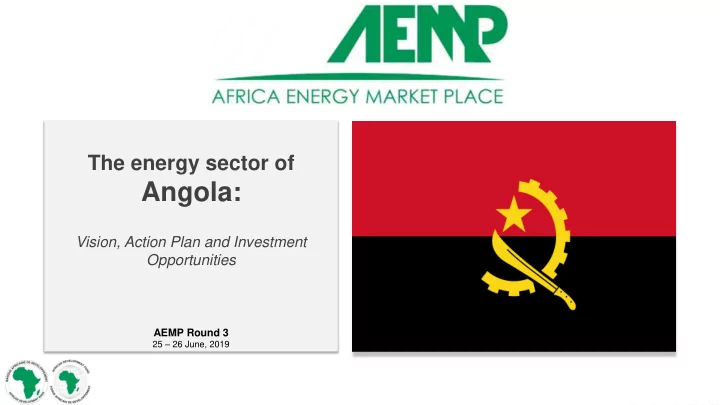
The energy sector of
Angola:
Vision, Action Plan and Investment Opportunities
AEMP Round 3
25 – 26 June, 2019
Angola: Vision, Action Plan and Investment Opportunities AEMP - - PowerPoint PPT Presentation
The energy sector of Angola: Vision, Action Plan and Investment Opportunities AEMP Round 3 25 26 June, 2019 1 Section 1 Country Energy Sector Overview 2 Angola believes that access to electricity is key to economic I. growth and
1
The energy sector of
Angola:
Vision, Action Plan and Investment Opportunities
AEMP Round 3
25 – 26 June, 2019
2
Section 1
Country Energy Sector Overview
3
Angola 2010:
Sub-Saharan Africa
Latin America and the Caribbean
Middle East and North Africa
World:
10% 20% 30% 40% 50% 60%
GDP per capita ($)
1000 2000 3000 4000 5000 6000 7000 8000 9000 10000 70% 80% 90% 100%
Angola believes that access to electricity is key to economic growth and country development, benefiting the overall population's standard of living and welfare.
Angola aims to double its electrification rate until 2025 and equal that of reference countries
Electricity and Income Correlation
Legend: The diameter indicates average energy consumption per capita Source: World Bank, 2010 Angola 2025 Increase electrification to 60%
Electrification rate
I.
4
investments mobilized.
mobilized.
2021 2018 2019 2020 2022 2023 2024 2025
I.
2018 – 2022: US$ 13.6 billion budget Angola Power Sector Long Term Vision 2025 2022 – 2025: US$ 23.1 billion budget 7.5 GW Target for 2022 9.9 GW Target for 2025
Long term Vision & Objectives
Angola’s strategy to Light up and power Africa by 2025
Milestones
Technical Assistance Transmission & Distribution Generation, Transmission & Distribution Policy Installed Capacity Target
5
System Sustainability Industry Competitiveness Ensure and Increase Electricity Supply
Key pillars
establish international interconnections
I.
Angola Energy Sector Action Plan
6
Angola Energy Sector Snapshot
Production Key Indicators
Households without power Access Rate
Population electrified localities / Total PopulationPeak energy consumption
(reached in 2014)
Average consumption growth rate (2008-2014)
Electricity production by source (2014) Energy consumption per client (2014)Potential
6,400 MW Total Installed Capacity
82 MW
Of supply is generated by IPPs
604 MW, or 13 projects, have conditions for quick grid connection . Several of these sites are close to the main network which minimizes technical restrictions or significant investments.3.9
GW Total wind energy potential
3.7
GW Biomass and waste potential
18.3
GW Hydro energy to be exploited
15.5% 36%
3.4 M
1.3 – 2.1
MWh/m2/year Average solar irradiance
Thermal 47% Hydro 53%
Residential 45% Services 32% Industry 9% Losses 14%I.
1650 MW
7
Angola Energy Programs, Policy & Reforms
Energy Sector Stakeholders
Regulator
Transmission Company
Distribution Company
Project Development
*On a local level, Provincial Governments (18 in total) have their
Country’s Priorities
The Angolan Government has an ambitious Action Plan for the period up to 2025 with around US $18 billion worth of investments into renewables underway, and it has a long-term vision for the power sector with a clear roadmap to provide modern electricity services to 60% of the population by 2025.
Country generation programs/Expansion plans
lines and over 40 substations are planned.
south backbone and expand the grid from 3,354 km to 16,350 km by 2025 and to connect to the Southern Africa Power Pool (SAPP) through Namibia (ANNA) and the Democratic Republic of Congo (Inga).
Energy Policies and Reforms
with US$ 1.2 billion through its Power Sector Reform Support Program to support the energy sector reforms undertaken by Angola between 2014 and 2017.
National Vision of 2025 to 2050.
I.
8
0.87 3.73 6.70 1.10 1.37 1.60 0.75 0.85 0.75 0.0 2.0 4.0 6.0 8.0 10.0 12.0 dez-13 dez-19 dez-25 Other Renewables Combined Cycle Conventional Thermal Hydro
3,354 5,200 6,123 1,000 2,000 3,000 4,000 5,000 6,000 7,000
2013 2019 2025
0.8 1.6 3.2 0.0 0.5 1.0 1.5 2.0 2.5 3.0 3.5
2013 2019 2025
Installed capacity
GW
2,0 GW 5,9 GW
Sources: Data 2012 – MINEA Expanded Council Board; Financial Reports ENE e EDEL; Estimated data PSEA, 2009, Data 2019 - MINEA
Quadrupling generation capacity is a key pillar for electrification and supply security X 4,5
Transmission grid
Kilometers
# Consumers
Millions A significant investment extending transmission lines to connect the new generation and unify the four transmission systems The expected growth in generation is followed by the extension of the distribution network and consumer base X 1,8 X 3
9,9 GW
I. To successfully achieve the proposed goals in the energy sector a large amount
9
Angola is managing large, concurrent infrastructure developments, carefully planned to take advantage of Angola's unique national resources – natural gas, hydro, wind and solar How to take advantage of Angolan natural resources
CABINDA ZAIRE UIGENorth System Center System South System
Grid connections until 2025 CONGOKwanza river – Laúca and Caculo-Cabaça
partnering with Sonangol/ Angola LNG
systems
Namibia and Congo
renewables sources
East System
SIMPLIFICATION
I.
10
Public Companies Restructuring
Distribution and Customer Operations Transmission Generation Private Investors Munici- palities Value Chain
Until 2015
Regulator
purchase all energy generated
negotiated by Single Buyers with generation companies
generation and distribution, with private players
energy efficiency to project poorer consumers
improvement
Market and Regulation Models
Engineering
Current Status
Transmission National Company
Distribution National Company
Private Concessions
Generation National Company
Private Investors
Engineering Office (for strategic projects)
I R S E A
Institiuto Regulador dos Serviços de Electricidade e de ÁguaI. The Electricity Sector Transformation Program (PTSE) sought to improve efficiency by unbundling activities and a new market regulation that allows private participation.
11
Section 2
Investment Opportunities
12
IMPACT
Project #1: Hydroelectric Power Plant – CHICAPA II
31.2
MW
20,800 1.25
CO2 kton/yr Households Electrified Emissions Savings
in Lunda Sul, which will increase the energy generation of Chicapa I, from 86.9 GWh/year to 135 GWh/year and improve the power supply to Saurimo, a growing city, to local mining industries as well as support the expansion of the transport network in the Eastern Region.
Deal Snapshot
areas;
provinces in access to drinking water;
Alignment with Action Plan
Chicapa River in Lunda Sul Chicapa I in Lunda Sul
II.
13
IMPACT 36
MW
25,000 37.2
CO2 kton/yr Households Electrified Emissions Savings
which will benefit the municipalities of Lucano, Luau and those located at border ot the Upper Zambezi region;
Deal Snapshot
Alignment with Action Plan
II.
Location of the Hydroelectric Power Plant of Luacano (Google Earth)
Project #2: Hydroelectric Power Plant – LUACANO
14
IMPACT 43.6
MW
29,000 1.2
CO2 kton/yr Households Electrified Emissions Savings
will benefit the municipalities of Cuango e Luzamba, Cafunfo, Luremo, Xá Muteba, Capenda Camulemba. In the future will support and stabilize the connection in Very High Tension between the North and the East Systems; Indicative annual production: 209 GWh
Deal Snapshot
Alignment with Action Plan
Project #3. Hydroelectric Power Plant – Vuka
Cuango River
II.
15
IMPACT 100
MW
66,000 21.9
CO2 kton/yr Households Electrified Emissions Savings
areas;
MW).
Alignment with Action Plan
Region Capacity (in MW) Annual Production (MWh/yr) Emission savings (CO2 ton/ yr) Central 30 57.51 36.61 South 70 136.33 86.79 Total 100 193.84 123.40
II.
Investment Opportunities in Solar Energy
16
IMPACT 652
MW
434,666 977.79
CO2 kton/yr Households Electrified Emissions Savings
areas;
Alignment with Action Plan
Region Capacity (in MW) Annual Production (MWh/yr) Emission savings (CO2 ton/ Yr) Central 168 414.62 263.95 North 134 373.63 237.86 South 350 747.69 475.98 Total 652 1535.94 977.79
II.
Investment Opportunities in Wind Energy
17
Economic Sustainability Social Sustainability Environmental Sustainability
II. The social, economic and environmental sustainability is the third building block for development in the Angolan electricity sector.
18
Thank you for your attention.
19
III.
20
Public Investment Programme For 2018-2022
Generation Transmission Distribution & Rural Electrification
plants in the North, Centre and South with reconversion to gas
East for 2025/2030
hydropower Plants
Hydro power evacuation
Central grids Interconnection
Centarl grids
KV
Electrification at 110 kv Dembos and Malanje
and tele metering in MT universal
Capital cities
Electrification (northern, central, southern and eastern grids)
Renewable energy
III.
21
Projects Open For Private Investors’ Participation
Conventional Large & Medium- Size Power Plants New & Renewable Energy Municipal & Rural Areas Distribution
Lobito 1 & 2 (750 MW)
Catumbela River;
Queve River;
(200MW);
Plants (58 MW);
Urban solid waste thermal plants (Luanda & Benguela);
(100 MW);
the Mini-Hydro programme.
municipal networks connected to the grid;
networks and creation of managing entities through partnership;
for isolated areas.
III.
22
Sistema Eléctrico de Angola
Hidráulica Térmica 60kV 110kV 220kV 400kVLegenda:
EólicaT H E
minea
T
7.5MWT
7.5MWH
16MWH
12.4MWH
42MWH
26MWT
15MW 18.4MWH Luachimo Chicapa I Nzagi Lucapa Luo Lumeje Luena Léua Camanongue Calonda Saurimo Chiumbe-Dala Chicapa II Luapasso Dundo Benguela Gabela
260+700MWBiópio Lobito Saco Namibe Lubango Matala 60+30MW
14,4MW 70MW20MW
18MWKuito Chinguar Katchiongo Huambo Caála Benfica Alto Catumbela Cunje Soyo
800MWPambos Sonhe Uige Maquela Zombo Boavista Cacuso Lucala ´ N’Dalatando Capanda Cambambe Cazenga Camama
22.8MW 520MW 172+105MW 92+42MWMorro Bento Filda M’Banza Congo Cavaco Catumbela Lomaum
50MWLaúca
2067MWWako Kungo Cacombo
24MWJamba Ya Oma
75MWXangongo Baynes
200MWJamba Tchamutete Gove
60MW 40,8MWMenongue
T
TRamiros H H H H
TT H T T H H H T H H Baia
TT
10MWMalanje
Tombwa E
100MWSumbe Catete Quileva Viana Cacuaco
III.