
SLIDE 1
SIKAP/STRIVE, INC.
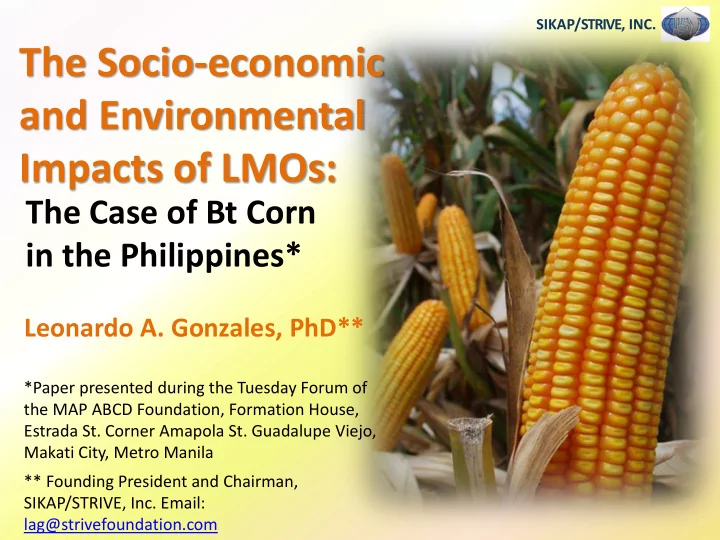
The Socio-economic and Environmental Impacts of LMOs:
The Case of Bt Corn in the Philippines*
*Paper presented during the Tuesday Forum of the MAP ABCD Foundation, Formation House, Estrada St. Corner Amapola St. Guadalupe Viejo, Makati City, Metro Manila ** Founding President and Chairman, SIKAP/STRIVE, Inc. Email: lag@strivefoundation.com