AGRICULTURE IN THE U.S. BIG DIVERSE FOUR REGIONS 2,000,000 FARMERS, - - PowerPoint PPT Presentation

agriculture in the u s big diverse four regions 2 000 000
SMART_READER_LITE
LIVE PREVIEW

AGRICULTURE IN THE U.S. BIG DIVERSE FOUR REGIONS 2,000,000 FARMERS, - - PowerPoint PPT Presentation

AGRICULTURE IN THE U.S. BIG DIVERSE FOUR REGIONS 2,000,000 FARMERS, 1% OF POPULATION 900,000 TILL 60% ACREAGE 80% Domestic 20% Exports SINCE 1950 170% INCREASE IN PRODUCTIVITY 26% LESS LAND 22,000,000 LESS FARMERS DELAWARE


slide-1
SLIDE 1

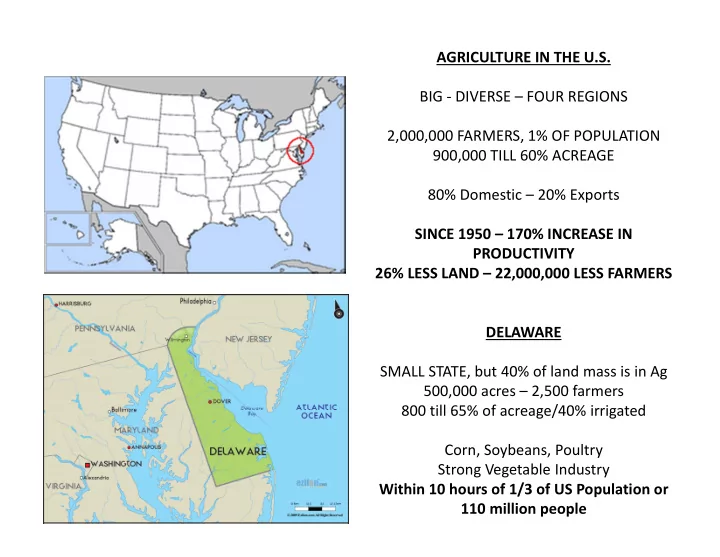
AGRICULTURE IN THE U.S. BIG ‐ DIVERSE – FOUR REGIONS 2,000,000 FARMERS, 1% OF POPULATION 900,000 TILL 60% ACREAGE 80% Domestic – 20% Exports SINCE 1950 – 170% INCREASE IN PRODUCTIVITY 26% LESS LAND – 22,000,000 LESS FARMERS DELAWARE SMALL STATE, but 40% of land mass is in Ag 500,000 acres – 2,500 farmers 800 till 65% of acreage/40% irrigated Corn, Soybeans, Poultry Strong Vegetable Industry Within 10 hours of 1/3 of US Population or 110 million people

slide-2
SLIDE 2

Farming in the U.S. is a Family Enterprise

slide-3
SLIDE 3

Innovation & Technology

  • At the end of World War II, in 1945,

there were 25 million dairy cows in the U.S. Today, there are 9 million, producing 60% more milk than 1945. The national average of 183 bushels produced on each acre in 2015 was

  • ver 20 percent larger than the

average yield in 2002 – and plant breeding experts estimate yields may jump 40 percent before 2020 and, perhaps, hit a national average of 300 bushels per acre by 2030.

slide-4
SLIDE 4

What does a State Ag Secretary Do?

  • 1. Advocate for Agriculture
  • 2. Regulatory Responsibilities
  • 3. Market Development and Innovation

12 states elect their Ag Secretary/38 are appointed by state Governor In the U.S. ‐ 3 major public sector support for Agriculture:

  • 1. USDA
  • 2. State Departments of Agriculture
  • 3. Land Grant Universities

Issues in Delaware

  • 1. Water Quality/Nutrient Management
  • 2. Farmland Preservation/Generational

Transfer

  • 3. GMO Labeling (US issue as well)
  • 4. Minimum wage laws
  • 5. Avian Influenza Surveillance
slide-5
SLIDE 5

Major Crop Acreage – U.S.

Acres Hectares Corn (Maize) 97,000,000 39,000,000 Soybeans 76,000,000 30,400,000 Wheat 49,000,000 19,600,000 Cotton 9,378,000 3,751,200 ALL Vegetables & Fruit 5,463,000 2,185,200*

slide-6
SLIDE 6

The U.S. Farm Bill

  • Since 1933 – 17 “Farm Bills”

– Safety Net for economic viability of Farmers: Income Support for farmers . . . . Also, Trade is emerging as a key part of the safety net – Safety Net to provide food for poor people and school lunch nutrition

  • programs. Food Stamps or SNAP (Supplemental Nutrition Assistance

Program (Since 1960s)

  • This created the urban:rural coalition

– Conservation

  • Major Farm Safety Net (Income Support) Management Goals:

– Influence Supply (primarily 1933‐1950, still exists but evolving to risk management) – Increase Demand (1950‐now) – Risk Management ‐‐‐ Crop Insurance

  • 1990s to today
slide-7
SLIDE 7

Farm Bill – Safety Net

  • Components of “Titles”
  • Nutrition
  • Crop Insurance
  • Conservation
  • Commodity Support
  • Other

– Research – Renewable Energy – Miscellaneous

slide-8
SLIDE 8

Policies 1,203,549 Acres 298,204,110 Liability $ 102,096,955,365 Total Premium $ 9,714,408,068 Subsidy $ 6,054,375,282 62%*

  • Overall average subsidy as percentage of total premium across 2015 U.S.

crops, coverage levels, and policies.

  • Subsidy paid to insurance companies to reduce subsidy cost to farmers

U.S Crop Insurance Summary ‐2015

slide-9
SLIDE 9

Government Income Support and its Share of Gross Cash Farm Income

slide-10
SLIDE 10

U.S. Farm “Factoids”

Food or Fuel??

  • Corn (Maize) 97,000,000

acres

– 40% of production goes to animal feed – 40% of production goes to ethanol

  • Observation: When the

Midwest Corn Belt has a good year – meet demand for both Organic Situation

  • 1% of US acreage is organic
  • 4.5% of food sales are organic
  • 80% of households make at

least one organic purchase/year

  • Primarily fruits and Vegetables
  • Delaware – Organically Raised

Chicken

slide-11
SLIDE 11

U.S. Grocery Stores – 40,000 stores, $700 billion sales/yr

Consumer Interests Cost Convenience Taste, but moving to – Health & Wellness 1.5 visits/week $100 ‐ $120/week Emerging Value Concerns Locally produced Environmentally Sensitive Animals Humanely Treated Organic Is it GMO?

slide-12
SLIDE 12

The Megatrends

Food and Agriculture

Shift in econom ic and trade flows Dem ographic and consum ption changes Rapid urbanisation Clim ate change and resource scarcity Technology consum ption and breakthroughs

Source: PwC

slide-13
SLIDE 13

Thank you for your commitment to Agriculture!

The farming, agriculture and food industry needs you – It needs you to be prepared for a wide array of issues, challenges, opportunities and successes!

slide-14
SLIDE 14

To feed 9.3 billion people

By 20 50 …

Global agricultural production needs to grow up to 70% PROFITABLE FARMS ARE CRITICAL TO MEETING THESE NEEDS!!! The U.S. Land Grant University System

  • 1. Teaching
  • 2. Research
  • 3. Cooperative Extension – Perhaps Unique – Bring the

University to the People A University, sometimes two, in each state Outreach through Extension to each of 3,000 counties in the United States University of Delaware

slide-15
SLIDE 15

My Grandchildren Will they have the same access to food and food choices that my generation has enjoyed? The decisions we make individually and collectively will decide their future!!

Thank you! Ed Kee, Sec. of Agriculture ‐ Delaware

“Future Gaelic Foot Ball Players! – the McKenzie Boys!”