
SLIDE 1
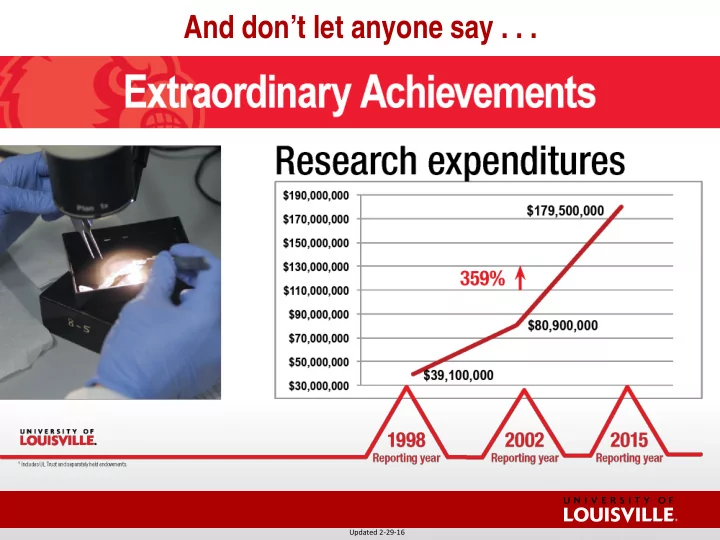
And don’t let anyone say . . .
Updated 2-29-16
And dont let anyone say . . . Updated 2-29-16 And dont let anyone - - PowerPoint PPT Presentation
And dont let anyone say . . . Updated 2-29-16 And dont let anyone say . . . Updated 2-29-16 And dont let anyone say . . . * *End of Bi-Centennial Campaign Updated 2-29-16 And our focus is Kentucky! 2014 KY Postsecondary Feedback
Updated 2-29-16
Updated 2-29-16
*
*End of Bi-Centennial Campaign
Updated 2-29-16
VS All 4 Year (Publics)
5,247 5,703 6,306 3,693 4,370 4,776
1,000 2,000 3,000 4,000 5,000 6,000 7,000
AY03/04 AY04/05 AY05/06 AY06/07 AY07/08 AY08/09 AY09/10 AY10/11 AY11/12 AY12/13 AY13/14 AY14/15
UK UofL
UK Total Change: 1,059 UofL Total Change: 1,083 UK % Change: +20.2% UofL % Change: +29.3%
Sources: UK (http://www.uky.edu/iraa); UofL Office of Institutional Research and Planning
*Does not include certificates; 2008-9 UofL figure (4,370) represents a revision from Just the Facts published figure (4,358).
61.1% 59.5% 61.3% 34.9% 48.4% 52.9%
0.0% 10.0% 20.0% 30.0% 40.0% 50.0% 60.0% 70.0% 1997 1998 1999 2000 2001 2002 2003 2004 2005 2006 2007 2008 2009
UK UofL
Sources: UK (http://www.uky.edu/iraa); UofL Office of Institutional Research and Planning
UK Change: + 0.2 points UofL Change: +18.0 points
2005 through 2014 Fiscal Years
$319.90 $372.93 $328.24 $139.94 $197.44 $183.38
$- $50.0 $100.0 $150.0 $200.0 $250.0 $300.0 $350.0 $400.0 FY2005 FY2006 FY2007 FY2008 FY2009 FY2010 FY2011 FY2012 FY2013 FY2014
UK UofL
Sources: National Science Foundation, National Center for Science and Engineering Statistics, Higher Education R&D Survey.
UK Total Change: $ 8.34 M UofL Total Change: $ 43.44 M UK % Change: + 2.6% UofL % Change: + 31.0%