
SLIDE 1
Nigel Unwin, 12 Nov. 2009
Analysing a small conformational change in acetylcholine receptor - - PowerPoint PPT Presentation
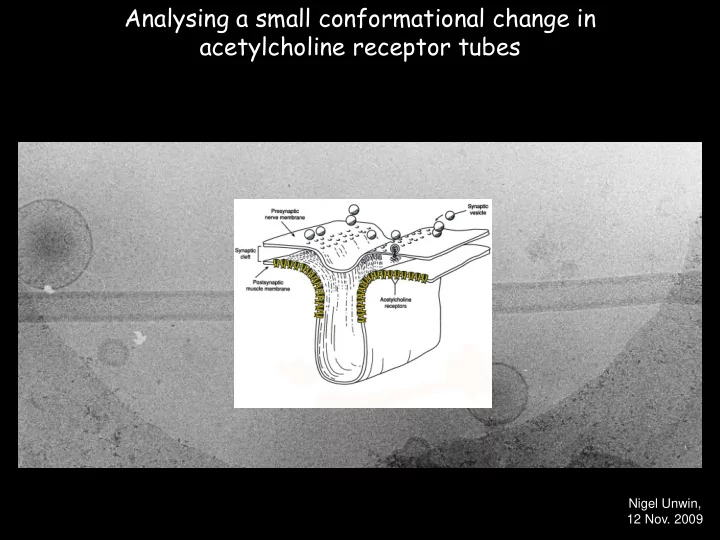
Analysing a small conformational change in acetylcholine receptor tubes Nigel Unwin, 12 Nov. 2009 Postsynaptic membranes from the Torpedo ray What is the single most important step in getting high quality structures? Specimen preparation
Nigel Unwin, 12 Nov. 2009
Beroukhim & Unwin, Ultramicroscopy 70:57 (1997)
6
Miyazawa et al., Nature 423:949 (2003) Unwin, J Mol Biol. 346:967 (2005)
β δ α γ α
Dellisanti, Chen et al. Nature Neurosc. 10:953-962 (2007)
Mouse α1(1.94Å) E L I C (3.3Å) AChBP (2.7Å)
Brejc, Sixma et al. Nature 411;269-276 (2001) Hilf and Dutzler, Nature 452:375-379 (2008)
native membrane
β-sheet core
r.m.s deviations (Å):
αm / αγ = 2.16 αm / αδ = 2.10 αm / β = 2.17 αm / γ = 1.81 αm / δ = 1.86 (αγ / AChBP = 2.43)
Dellisanti, Chen et al.,
Cys-loop C-loop
ELIC 3.3Å UDM, pH 6.5 Nature 452: 375 (2008) GLIC 2.9Å, DDM, pH 4.0 Nature 457:111 (2008) GLIC 3.1Å, TDM, pH 4.6 Nature 457: 115 (2008)
ACh receptor GLIC ‘apparently
GLIC ‘potentially
ELIC ‘closed’
β1-β2 β8
α subunit
10°
Cys loop
M4 M3 M2 M1
M3 M1 M2 M4
δ β γ α α
Que uesti tions
What are the actual ACh-induced movements in the ligand-binding domain? How do they bring about the change in configuration of helices in the membrane (coupling across interface)? What is the change in helix configuration which opens the pore and lets ions through? Str trate tegy gy: Mimic synaptic activation (ACh concentration, duration and membrane setting). Minimise effects of systematic errors by comparing ACh-activated and non-activated tubes from the same em grids.
ferritin
Manzello & Yang,
loss of crystal contact near ACh binding site appearance of desensitised conformation
Dilger and Brett, Biophys J. 57: 723 (1990)
Berriman & Unwin, Ultramicroscopy 56:241 (1994)
First, what resolution can you expect from a single short (~5000Å long) tube? So 20Å is the highest resolution obtainable in practice from
FSC0.5 = 20Å
The helical structure would be equivalent to a structure obtained from 1500 single particles, with perfect alignment and equal sampling of all views
difference between reference structures
Contours at p=0.001
difference between sorted structures
(pink: increase, blue: decrease in density associated with addition of ACh)
‘Ghosts’ are present in averaged 3D maps calculated from images of ACh- activated tubes because some tubes exhibit short-range disorder due to the loss
(1/7 Å-1)
To identify (and subsequently eliminate) bad images:
One way is to remove the suspect image from the averaged dataset and see if measures of agreement with a known structure, and annular phase errors in the Fourier transform improve or get worse Another (less objective) way is to include the image in the data set at say 10x its correct weight and look at the effect on the 3D map.
closed class