An overview of CFD applications in flow assurance From well head to - - PowerPoint PPT Presentation

an overview of cfd applications in flow assurance from
SMART_READER_LITE
LIVE PREVIEW

An overview of CFD applications in flow assurance From well head to - - PowerPoint PPT Presentation

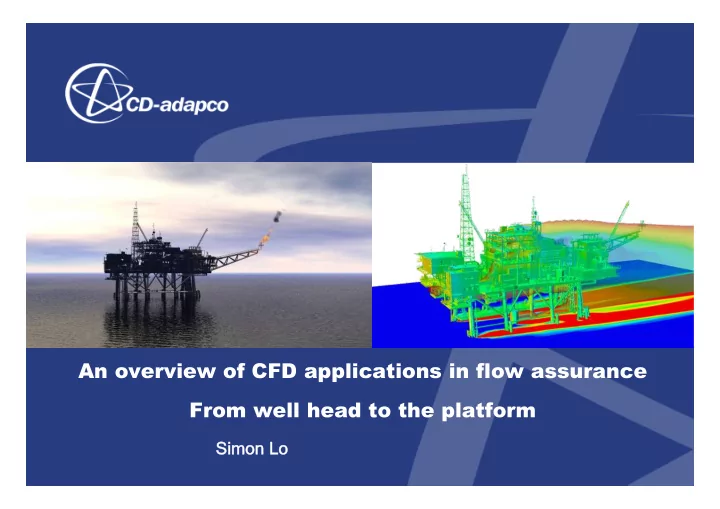
An overview of CFD applications in flow assurance From well head to the platform Simo Simon Lo Contents From well head to the platform Heat transfer in Christmas tree Multiphase flow in long pipe Severe slugging in riser Sand


slide-1
SLIDE 1

An overview of CFD applications in flow assurance From well head to the platform

Simo Simon Lo

slide-2
SLIDE 2

Contents – From well head to the platform

  • Heat transfer in Christmas tree
  • Multiphase flow in long pipe
  • Severe slugging in riser
  • Sand transport in pipes
  • Temperature effects in transportation of viscous oil
  • Hydrate formation
  • Slug flow around pipe elbow
  • Riser V&V
  • 3 phase separator
  • Wave impact on platform
  • Launching of lifeboat
slide-3
SLIDE 3

Flow in and around a Christmas tree

slide-4
SLIDE 4

Flow inside a Christmas tree

slide-5
SLIDE 5

Temperature distribution inside a Christmas tree

slide-6
SLIDE 6

Oil and gas flow in 100m pipeline

slide-7
SLIDE 7

4 inch riser 55 m pipeline 10.5 m Riser top Riser base Riser DP = Pbase - Ptop

Severe slugging in riser, Uni of Cranfield, UK

50 100 150 200 250 300 350 0.2 0.4 0.6 0.8 1 Flow time t, s Riser DP, bar Experiment Star-CD-1 Star-CD-2

slide-8
SLIDE 8

DEM – particle transport in pipe

slide-9
SLIDE 9

DEM - Pneumatic conveying of particles in pipe

slide-10
SLIDE 10

Horizo rizontal l slu slurry rry pip ipelin line flo low

Liq iquid id ve velo locit city y Inle let Outle let Mid Middle le

Pa Part rticle icle vo volu lume me fra ract ctio ion

Slurry flow in horizontal pipe

Unif iform rm so solid lid vo volu lume me fra ract ctio ion (vf vf) ) and slu slurry rry ve velo locit city y (V) (V) g g L=1 =10m m V V 1m m D D Me Measu sure reme ment pla lane

slide-11
SLIDE 11

Slurry flow in pipe

d=9 =90 µm, , vf=0 =0.19, D=1 =103mm, mm, V=3 V=3 m/ m/s s d=1 =165 µm, , vf=0 =0.189, D=5 =51.5mm, mm, V=4 V=4.17 m/ m/s s

Unif iform rm so solid lid vo volu lume me fra ract ctio ion (vf vf) ) and slu slurry rry ve velo locit city y (V) (V) g g L=1 =10m m V V 1m m D D Me Measu sure reme ment pla lane

d=2 =270 µm, , vf=0 =0.2, D=5 =51.5mm mm V=5 V=5.4 m/ m/s s d=1 =165 µm, , vf=0 =0.0918 D=5 =51.5mm mm V=3 V=3.78 m/ m/s s d=4 =480 µm, , vf=0 =0.203, D=5 =51.5mm mm V=3 V=3.41 m/ m/s s d=1 =165 µm, , vf=0 =0.273, D=4 =495mm mm V=3 V=3.46 m/ m/s s

slide-12
SLIDE 12

Effects of cooling in transportation of viscous oil

  • Temperature, density and viscosity after 200m.

Temp mpera rature re Densit sity y Visco Viscosit sity y

120 120 cP cP 20 20 cP cP

slide-13
SLIDE 13

Sec. 01 Sec. 02 Sec. 03 Sec. 04 Sec. 05 Sec. 06 Sec. 07 Sec. 08 Sec. 09 Sec. 10 A-1 0.084 6 0.075 6 0.075 6 0.075 6 0.075 6 0.075 6 0.075 6 0.075 6 0.075 6 0.075 6 A-2 0.145 5 0.174 0.203 0.226 9 0.247 3 0.264 9 0.280 2 0.293 6 0.305 2 0.315 4 0.00 0.05 0.10 0.15 0.20 0.25 0.30 0.35 Shear Stress [N]

  • Increase in wall shear stress and pressure drop as viscosity

increases.

Wall shear stress and pressure drop along pipe

Iso sotherma rmal Wit ith co coolin ling

slide-14
SLIDE 14

A CFD hydrate formation model

  • Oil-dominated 3 phase flow

Oil il Water r Gas s Hyd ydra rate + + water r Hyd ydra rate

  • Eulerian multiphase flow model:
  • Phase 1: Oil – continuous fluid
  • Phase 2: Gas – dispersed bubbles
  • Phase 3: Water/hydrate – dispersed droplets (fH=0) turn into

hydrate particles (fH=1)

slide-15
SLIDE 15

Hydrate formation process

1.

Methane (CH4) from gas bubbles is dissolved into the oil.

2.

Water droplets come into contact with dissolved CH4, turn into hydrate particles when the temperature drops below the hydrate nucleation temperature.

3.

The dissolved gas is consumed in the hydrate formation process.

Oil il Water r Gas s Hyd ydra rate + + water r Hyd ydra rate

slide-16
SLIDE 16

Temperature, hydrate and dissolved gas

Temp mpera rature re of oil il (Note areas cooler than hydrate nucleation temperature of 15.6°C.) Hyd ydra rate fra ract ctio ion in in water r (Hydrate starts to form when temperature drops below 15.6°C.) Ma Mass ss fra ract ctio ion of disso issolve lved gas s in in oil il (Dissolved gas is consumed in hydrate formation and recovered when hydrate formation is completed.)

slide-17
SLIDE 17

Pigging – Overset mesh for moving pig

St Stra ratif ifie ied gas-liq s-liquid id flo low Disp isperse rsed so solid lid-liq

  • liquid

id flo low

slide-18
SLIDE 18

Dynamic forces on pipe elbow in slug flow

Mass flux, velocity and density of each phase Pressure and temperature Flow direction Mo Model l the lo long pip ipe usin sing OLGA A wit ith slu slug tra rackin cking Mo Model l pip ipe elb lbow usin sing ST STAR AR-C

  • CCM+

M+

slide-19
SLIDE 19

Pressure variation due to slug flow pass elbow

Gas s vo volu lume me fra ract ctio ion Pre Pressu ssure re on the outer r part rt Note the passin ssing of liq liquid id slu slug in in “b “blu lue”. ”. Note the in incre crease se in in pre ressu ssure re as s liq liquid id slu slug passe sses. s.

slide-20
SLIDE 20

Comparison

Coupling model Experiment Slug frequency (Hz) 0.5 0.5 Slug velocity (m/s) slug front: 2.8 to 3.6 slug tail: 3.0 to 3.5 3.6 Peak force on bend (N) 44 to 54 40 to 60 Maximum force on bend (N) 54 60 In in indust stria rial l desig sign wit ith sa safety y fact ctor r ‘2’: ma maximu ximum m force rce 141 141 N N

slide-21
SLIDE 21

Flow-Merging T-junctions

Application Proving Group

Planar 60º 90º

21

slide-22
SLIDE 22

Jumpers

Application Proving Group

22

JumperBend JumperRec

slide-23
SLIDE 23

Pig Launcher / Cross over

Application Proving Group

23

slide-24
SLIDE 24

Oil Platform Riser Vortex Induced Vibration

  • Riser pipe via FV Stress
  • URANS (Unsteady-Reynolds Average NS)
  • k-ω turbulence model y+<10
  • 2nd order time fluid and solid

– Time step 1/100 of Vortex Shedding Period

  • Implicit Coupled – Morphed 1 per time step
  • Good Agreement

– Drag (Cd) Shedding (St), Natural frequency

24

slide-25
SLIDE 25

Oil Platform Riser Vortex Induce Vibration

25

Mid Mid-sp

  • span cro

cross-st ss-stre ream m disp ispla lace ceme ment Mid Mid-sp

  • span st

stre ream-w m-wise ise disp ispla lace ceme ment

slide-26
SLIDE 26

Separator Upstream pipework Baffle plate Inlet Diffuser Vortex breaker Oil outlet

Vane packs Gas outlet Downcomer

Inlet

  • Modeling strategy:

– Local model of diffuser and vane pack – Global model of separator

slide-27
SLIDE 27

Nottingham – Multiphase flow in bend pipes

Larg rge bubble les Me Mediu ium m bubble les Sma Small ll bubble les Liq iquid id

4-p

  • phase

se mo model

27

slide-28
SLIDE 28

3-phase separator

28

Gas s Oil il Water r Court rtesy sy of Rhin ine Ruhr r / LSI SIM M Au Aust stra ralia lia

slide-29
SLIDE 29

Wave loading on platform

  • Hig

igh fid idelit lity y wit ith mu mult lti-p i-physics: ysics:

  • Win

ind and wave ve lo loadin ings s

  • St

Stre ress ss

slide-30
SLIDE 30

High fidelity, large domain, time dependent

slide-31
SLIDE 31

Launching of life boat

LIFEBOAT LAUNCHING

  • combined 6 DOF, overlapping mesh, VOF (compressible)
slide-32
SLIDE 32

Conclusions

  • CFD is becoming more widely used in flow assurance to study:

– Flow details in 3D: pipelines, equipment, junctions, valves, … – Thermal management, conjugate heat transfer, cold down,

temperature dependent density and viscosity, hydrate, wax, ...

– Fluid-structure interactions: VIV in risers, sloshing in tanks.

  • CFD technology is being developed to support the modelling of

the complex flows:

– Advanced grid generation methods. – Advanced multiphase flow models. – Fast parallel solver to handle large complex models. – Powerful visualisation technique to explain the complex flow.