
SLIDE 1
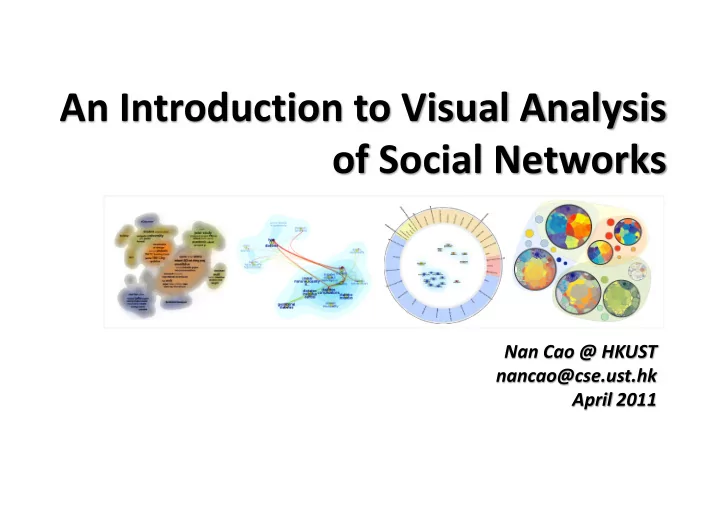
An Introduction to Visual Analysis
- f Social Networks
Nan Cao @ HKUST nancao@cse.ust.hk April 2011
An Introduction to Visual Analysis of Social Networks Nan Cao @ - - PowerPoint PPT Presentation
An Introduction to Visual Analysis of Social Networks Nan Cao @ HKUST nancao@cse.ust.hk April 2011 Agenda Introductions to visual analysis Community representation Analysis on Rich Context Social Medias Introduction Equation Tag
Nan Cao @ HKUST nancao@cse.ust.hk April 2011
Equation Tag Clouds extracted from “Mining Organizational Structure in Social Network”
– An automatic analysis process bases on various models for different purposes – Maximize the power of machines
– Leverage human’s capability on pattern recognition and represent the multidimensional data in an intuitive way using various visual encodings – Maximize the power for human beings
– A semi-automatic analysis process that combines analysis model (DM), visual representation (Visualization) as well as user interactions (HCI) together. – Seamlessly connect humans with machines for the analysis purpose
Raw Data Abstract Data
Data Mining
Layout / Coloring / Sizing
filtering Visual Form
Display
rendering View
References [1] Readings in Information Visualization: Using Vision to Think, Stuart K. Card, Jock Mackinlay, Ben
[2] prefuse: A Toolkit for Interactive Information Visualization, Jeffery Heer, Stuart K. Card, James A. Landay, ACM sigCHI, 2005 User
interactions
Raw Data Abstract Data
Data Mining
Layout / Coloring / Sizing
filtering Visual Form
Display
rendering View User
interactions
– Graph layout, as a branch of graph theory, applies topology and geometry to derive two-dimensional representations of graphs – Wikipedia
– Group the nodes with strong connections together (same as community detection). – Reduce overlaps of the nodes – Minimize the average edge length (reduce line crossings) – Keep a good symmetry of the graph (It is easier for users to identify patterns in a symmetry structure)
Edge oriented Structure
Cluster
Hierarchy
Edge oriented Structure
Cluster
Hierarchy
Graph layout, as a branch of graph theory, applies topology and geometry to derive 2D representations of graphs – Wikipeia
13
iterative optimization process
guaranteed!
Layou t Ene rgy Radom Layout Fine Result
– Proximity preservation: similar nodes are
– Symmetry preservation: isomorphic sub-
– Minimized Edge length: reduce edge
– No external influences: “Let the graph speak
15
Edges are springs Vertices are repelling particles Force on vertex:
fuv is force on spring
guv is repelling force
V u uv E v u uv
} , {
References: [3]A heuristic for drawing graph, P.Eades, 84. [4]Graph Drawing by Force-Directed Graph, Fruchterman, 91. [5]Drawing Graph Nicely Using Simulated Annealing, Davidson, 96. [6]A Fast Adaptive Layout Algorithm for Undirected Graphs, Frick, 94. [7]Spring Algorithms and Symmetry, Eades and X Lin, 99
Clustering Model Layout Model
j i ij j i
d X X
2
|| || min
j i ij j i
d X X d
2 2
|| || 1 min
LX X Tr
T
min
n E j i j i ij T
X X LX X
, 2
) ( min 2 1 min
Spring Embed Model [3-7] MDS Layout Model [8]
[8] Graph Drawing by Stress Majorization, 2002, Graph Drawing [9] An r-Dimensional Quadratic Placement Algorithm, Kenneth M. Hall, 1970 [10] ACE: A fast multiscale eigenvector computation for drawing huge graphs, Y.Koren, L. Carmel and D. Harel, InfoVis 2002
Spectrum Model [9, 10]
Raw Data Abstract Data
Data Mining
Layout / Coloring / Sizing
filtering Visual Form
Display
rendering View User
interactions
Each vertex has
age / sex / jobs location : city /county /state contact : emails / phones Degree / Closeness / Betweenness / Spectrum friends colleagues classmate family
The vertexes are connected by multiple relations
[11] NodeTrix: A Hybrid Visualization of Social Networks, Nathalie Henry et al. IEEE TVCG 2007 Demo:http://www.youtube.com/watch?v=7G3MxyOcHKQ
[11] NodeTrix: A Hybrid Visualization of Social Networks, Nathalie Henry et al. IEEE TVCG 2007 Demo:http://www.youtube.com/watch?v=7G3MxyOcHKQ
[11] NodeTrix: A Hybrid Visualization of Social Networks, Nathalie Henry et al. IEEE TVCG 2007 Demo:http://www.youtube.com/watch?v=7G3MxyOcHKQ
[12] FacetAtlas: Multifaceted Visualization for Rich Text Corpora, Nan Cao, et al. IEEE TVCG 2010
23
multiple facets
24
Metabolic Syndrome
(Q1) How to model the document contents into multifaceted relation data? (Q2) How to intuitively visualize multifaceted document contents and their relations? (Q3) How to find the insight patterns visually driven by users’ interests?
25
Metabolic Syndrome
(Q1) How to model the document contents into multifaceted relation data? (Q2) How to intuitively visualize multifaceted document contents and their relations? (Q3) How to find the insight patterns visually driven by users’ interests?
How to visualize the relations
26
document set entity set multifaceted entity relational data model facet segmentation symptom disease treatment entity extraction
type 1 diabetes type 2 diabetes take medications blood sugar control thirst blurred vision
Internal relations External relations
Each vertex has
age / sex / jobs location : city /county /state contact : emails / phones Degree / Closeness / Betweenness / Spectrum friends colleagues classmate family
The vertexes are connected by multiple relations
[13] The FlowVizMenu and Parallel Scatterplot Matrix: Hybrid Multidimensional Visualizations for Network Exploration. IEEE TVCG 2010 Demo: http://www.youtube.com/watch?v=f9Z0mPOnG_M
Scatter Plot Matrix
Index Cluster Coef Degree Eigenvector Closeness min max [14] A. Inselberg and B. Dimsdale. Parallel coordinates: a tool for visualizing multi- dimensional geometry, InfoVis 2000
Ben Shneiderma. 1999
and D. Harel, InfoVis 2002
Network Exploration. IEEE TVCG 2010
geometry, InfoVis 2000
Nan Cao @ HKUST nancao@cse.ust.hk April 2011