
SLIDE 1
E X P E R I E N C E Y O U R A M E R I C A
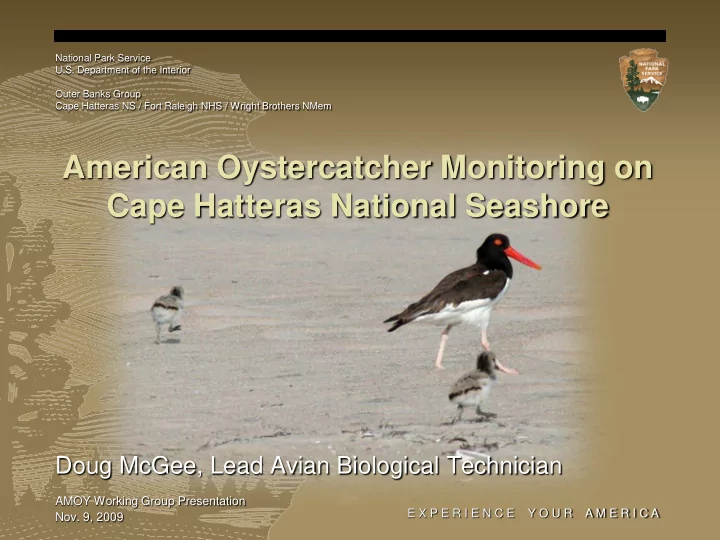
National Park Service U.S. Department of the Interior Outer Banks Group Cape Hatteras NS / Fort Raleigh NHS / Wright Brothers NMem
Doug McGee, Lead Avian Biological Technician
AMOY Working Group Presentation
- Nov. 9, 2009