Amdahls Law Example #2 Protein String Matching Code 4 days - - PowerPoint PPT Presentation

amdahl s law example 2
SMART_READER_LITE
LIVE PREVIEW

Amdahls Law Example #2 Protein String Matching Code 4 days - - PowerPoint PPT Presentation

Amdahls Law Example #2 Protein String Matching Code 4 days execution time on current machine 20% of time doing integer instructions 35% percent of time doing I/O Which is the better tradeoff? Compiler optimization that


slide-1
SLIDE 1

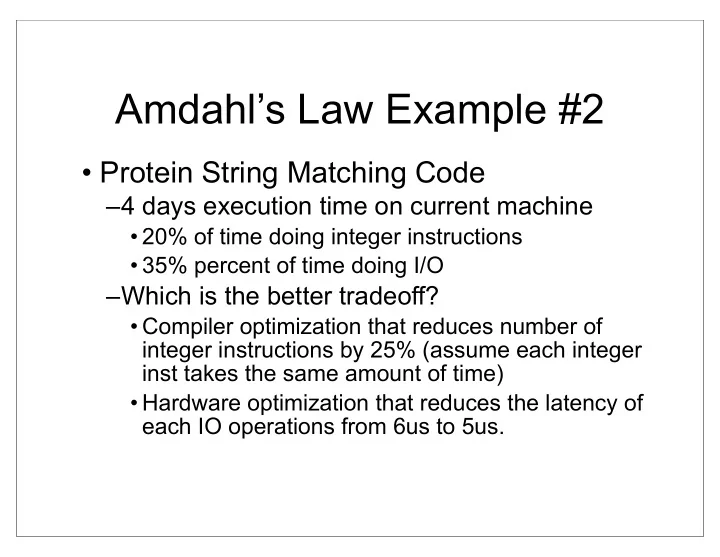
Amdahl’s Law Example #2

  • Protein String Matching Code

–4 days execution time on current machine

  • 20% of time doing integer instructions
  • 35% percent of time doing I/O

–Which is the better tradeoff?

  • Compiler optimization that reduces number of

integer instructions by 25% (assume each integer inst takes the same amount of time)

  • Hardware optimization that reduces the latency of

each IO operations from 6us to 5us.

slide-2
SLIDE 2

Amdahl’s Corollary #2

  • Make the common case fast (i.e., x should be

large)!

–Common == “most time consuming” not necessarily “most frequent” –The uncommon case doesn’t make much difference –Be sure of what the common case is –The common case changes.

  • Repeat…

–With optimization, the common becomes uncommon and vice versa.

slide-3
SLIDE 3

Amdahl’s Corollary #2: Example

Common case 7x => 1.4x 4x => 1.3x 1.3x => 1.1x Total = 20/10 = 2x

  • In the end, there is no common case!
  • Options:

– Global optimizations (faster clock, better compiler) – Find something common to work on (i.e. memory latency) – War of attrition – Total redesign (You are probably well-prepared for this)

slide-4
SLIDE 4

Amdahl’s Corollary #3

  • Benefits of parallel processing
  • p processors
  • x% is p-way parallizable
  • maximum speedup, Spar

Spar = 1 . (x/p + (1-x))

x is pretty small for desktop applications, even for p = 2

slide-5
SLIDE 5

Example #3

  • Recent advances in process technology have

quadruple the number transistors you can fit

  • n your die.
  • Currently, your key customer can use up to 4

processors for 40% of their application.

  • You have two choices:

–Increase the number of processors from 1 to 4 –Use 2 processors but add features that will allow the applications to use them for 80% of execution.

  • Which will you choose?

37

slide-6
SLIDE 6

Amdahl’s Corollary #4

  • Amdahl’s law for latency (L)
  • By definition

–Speedup = oldLatency/newLatency –newLatency = oldLatency * 1/Speedup

  • By Amdahl’s law:

–newLatency = old Latency * (x/S + (1-x)) –newLatency = oldLatency/S + oldLatency*(1-x)

  • Amdahl’s law for latency

–newLatency = oldLatency/S + oldLatency*(1-x)

slide-7
SLIDE 7

Amdahl’s Non-Corollary

  • Amdahl’s law does not bound slowdown

– newLatency = oldLatency/S + oldLatency*(1-x) – newLatency is linear in 1/S

  • Example: x = 0.01 of execution, oldLat = 1

–S = 0.001;

  • Newlat = 1000*Oldlat *0.01 + Oldlat *(0.99) = ~ 10*Oldlat

–S = 0.00001;

  • Newlat = 100000*Oldlat *0.01 + Oldlat *(0.99) = ~ 1000*Oldlat
  • Things can only get so fast, but they can get

arbitrarily slow. –Do not hurt the non-common case too much!

slide-8
SLIDE 8

Amdahl’s Example #4

This one is tricky

  • Memory operations currently take 30% of

execution time.

  • A new widget called a “cache” speeds up 80% of

memory operations by a factor of 4

  • A second new widget called a “L2 cache” speeds

up 1/2 the remaining 20% by a factor or 2.

  • What is the total speed up?

40

slide-9
SLIDE 9

Answer in Pictures

41

L1 L1 sped up L 2 n a Not memory L1 sped up n a Not memory L 2 n a Not memory

Memory time 0.24 0.03 0.03 0.7 0.7 0.7 0.03 0.03 0.06 0.03 0.015 0.06 Total = 0.82 Total = 1 Total = 0.805 85% 4.2% 4.2% 8.6% 24% 3% 3% 70%

Speed up = 1.242

slide-10
SLIDE 10

Amdahl’s Pitfall: This is wrong!

  • You cannot trivially apply optimizations one at a time with

Amdahl’s law.

  • Just the L1 cache
  • S1 = 4
  • x1 = .8*.3
  • StotL1 = 1/(x1/S1 + (1-x1))
  • StotL1 = 1/(0.8*0.3/4 + (1-(0.8*0.3))) = 1/(0.06 + 0.76) = 1.2195 times
  • Just the L2 cache
  • SL2 = 2
  • xL2 = 0.3*(1 - 0.8)/2 = 0.03
  • StotL2’ = 1/(0.03/2 + (1-0.03)) = 1/(.015 + .97) = 1.015times
  • Combine
  • StotL2 = StotL2’ * StotL1 = 1.02*1.21 = 1.237
  • What’s wrong? -- after we do the L1 cache, the execution time

changes, so the fraction of execution that the L2 effects actually grows

42

<- This is wrong

slide-11
SLIDE 11

Answer in Pictures

43

L1 L1 sped up L 2 n a Not memory L1 sped up n a Not memory L 2 n a Not memory

Memory time 0.24 0.03 0.03 0.7 0.7 0.7 0.03 0.03 0.06 0.03 0.015 0.06 Total = 0.82 Total = 1 Total = 0.805 85% 4.2% 4.2% 8.6% 24% 3% 3% 70%

Speed up = 1.242

slide-12
SLIDE 12

Multiple optimizations: The right way

  • We can apply the law for multiple optimizations
  • Optimization 1 speeds up x1 of the program by S1
  • Optimization 2 speeds up x2 of the program by S2

Stot = 1/(x1/S1 + x2/S2 + (1-x1-x2)) Note that x1 and x2 must be disjoint! i.e., S1 and S2 must not apply to the same portion of execution. If not then, treat the overlap as a separate portion of execution and measure it’s speed up independently ex: we have x1only, x2only, and x1&2 and S1only, S2only, and S1&2, Then Stot = 1/(x1only/S1only + x2only/S2only + x1&2/S1&2+ (1-x1only-x2only+x1&2))

44

slide-13
SLIDE 13

Multiple Opt. Practice

  • Combine both the L1 and the L2
  • memory operations = 0.3
  • SL1 = 4
  • xL1 = 0.3*0.8 = .24
  • SL2 = 2
  • xL2 = 0.3*(1 - 0.8)/2 = 0.03
  • StotL2 = 1/(xL1/SLl + xL2/SL2 + (1 - xL1 - xL2))
  • StotL2 = 1/(0.24/4 + 0.03/2 + (1-.24-0.03))

= 1/(0.06+0.015+.73)) = 1.24 times

  • 45
slide-14
SLIDE 14

Bandwidth

  • The amount of work (or data) per time
  • MB/s, GB/s -- network BW, disk BW, etc.
  • Frames per second -- Games, video transcoding
  • Also called “throughput”

46

slide-15
SLIDE 15

Measuring Bandwidth

  • Measure how much work is done
  • Measure latency
  • Divide

47

slide-16
SLIDE 16

Latency-BW Trade-offs

  • Often, increasing latency for one task can lead to

increased BW for many tasks.

  • Think of waiting in line for one of 4 bank tellers
  • If the line is empty, your latency is low, but throughput is low too

because utilization is low.

  • If there is always a line, you wait longer (your latency goes up), but

there is always work available for tellers.

  • Which is better for the bank? Which is better for you?
  • Much of computer performance is about scheduling

work onto resources

  • Network links.
  • Memory ports.
  • Processors, functional units, etc.
  • IO channels.
  • Increasing contention for these resources generally increases

throughput but hurts latency.

48

slide-17
SLIDE 17

Reliability Metrics

  • Mean time to failure (MTTF)
  • Average time before a system stops working
  • Very complicated to calculate for complex systems
  • Why would a processor fail?
  • Electromigration
  • High-energy particle strikes
  • cracks due to heat/cooling
  • It used to be that processors would last longer

than their useful life time. This is becoming less true.

49

slide-18
SLIDE 18

Power/Energy Metrics

  • Energy == joules
  • You buy electricity in joules.
  • Battery capacity is in joules
  • To minimizes operating costs, minimize energy
  • You can also think of this as the amount of work that

computer must actually do

  • Power == joules/sec
  • Power is how fast your machine uses joules
  • It determines battery life
  • It is also determines how much cooling you need. Big

systems need 0.3-1 Watt of cooling for every watt of compute.

50

slide-19
SLIDE 19

Power in Processors

  • P = aCV2f
  • a = activity factor (what fraction of the xtrs switch every

cycles)

  • C = total capacitance (i.e, how many xtrs there are on

the chip)

  • V = supply voltage
  • f = clock frequency
  • Generally, f is linear in

V, so P is roughly f3

  • Architects can improve
  • a -- make the micro architecture more efficient. Less

useless xtr switchings

  • C -- smaller chips, with fewer xtrs

51

slide-20
SLIDE 20

Metrics in the wild

  • Millions of instructions per second (MIPS)
  • Floating point operations per second (FLOPS)
  • Giga-(integer)operations per second (GOPS)
  • Why are these all bandwidth metric?
  • Peak bandwidth is workload independent, so these

metrics describe a hardware capability

  • When you see these, they are generally GNTE

(Guaranteed not to exceed) numbers.

52

slide-21
SLIDE 21

More Complex Metrics

  • For instance, want low power and low latency
  • Power * Latency
  • More concerned about Power?
  • Power2 * Latency
  • High bandwidth, low cost?
  • (MB/s)/$
  • In general, put the good things in the numerator,

the bad things in the denominator.

  • MIPS2/W

53

slide-22
SLIDE 22

Stationwagon Digression

  • IPv6 Internet 2: 272,400 terabit-meters per second

–585GB in 30 minutes over 30,000 Km –9.08 Gb/s

  • Subaru outback wagon

– Max load = 408Kg – 21Mpg

  • MHX2 BT 300 Laptop drive

– 300GB/Drive – 0.135Kg

  • 906TB
  • Legal speed: 75MPH (33.3 m/s)
  • BW = 8.2 Gb/s
  • Latency = 10 days
  • 241,535 terabit-meters per second
slide-23
SLIDE 23

Prius Digression

  • IPv6 Internet 2: 272,400 terabit-meters per second

–585GB in 30 minutes over 30,000 Km –9.08 Gb/s

  • My Toyota Prius

– Max load = 374Kg – 44Mpg (2x power efficiency)

  • MHX2 BT 300

– 300GB/Drive – 0.135Kg

  • 831TB
  • Legal speed: 75MPH (33.3 m/s)
  • BW = 7.5 Gb/s
  • Latency = 10 days
  • 221,407 terabit-meters per second (13%

performance hit)