AMBEV REPORTS 2017 FIRST QUARTER RESULTS UNDER IFRS So Paulo, May 4, - - PDF document

ambev reports 2017 first quarter results under ifrs
SMART_READER_LITE
LIVE PREVIEW

AMBEV REPORTS 2017 FIRST QUARTER RESULTS UNDER IFRS So Paulo, May 4, - - PDF document

First Quarter 2017 Results May 4, 2017 Page 1 AMBEV REPORTS 2017 FIRST QUARTER RESULTS UNDER IFRS So Paulo, May 4, 2017 Ambev S.A. [BOVESPA: ABEV3; NYSE: ABEV] announces today its results for the 2017 first quarter (1Q17). The following


slide-1
SLIDE 1

First Quarter 2017 Results May 4, 2017 Page 1

This press release segregates the impact of organic changes from those arising from changes in scope or currency translation. Scope changes represent the impact of acquisitions and divestitures, the start up or termination of activities or the transfer of activities between segments, curtailment gains and losses and year over year changes in accounting estimates and other assumptions that management does not consider as part of the underlying performance of the business. Unless stated, percentage changes in this press release are both organic and normalized in nature. Whenever used in this document, the term “normalized” refers to performance measures (EBITDA, EBIT, Profit, EPS) before special items adjustments. Special items are either income or expenses which do not occur regularly as part of the normal activities of the Company. They are presented separately because they are important for the understanding of the underlying sustainable performance of the Company due to their size or nature. Normalized measures are additional measures used by management and should not replace the measures determined in accordance with IFRS as indicators of the Company’s performance. Comparisons, unless otherwise stated, refer to the first quarter of 2016 (1Q16). Values in this release may not add up due to rounding.

AMBEV REPORTS 2017 FIRST QUARTER RESULTS UNDER IFRS

São Paulo, May 4, 2017 – Ambev S.A. [BOVESPA: ABEV3; NYSE: ABEV] announces today its results for the 2017 first quarter (1Q17). The following operating and financial information, unless otherwise indicated, is presented in nominal Reais and prepared according to International Financial Reporting Standards (IFRS), and should be read together with our quarterly financial information for the three-month period ended March 31st, 2017 filed with the CVM and submitted to the SEC.

Top line performance: Top line was up 8.0% in the quarter, driven by growth in all operations: Brazil (+0.6%), Latin America South (LAS) (+27.4%), Central America and the Caribbean (CAC) (+5.5%) and Canada (+2.3%). Consolidated volumes were up 2.4%, growing in most regions, and net revenue per hectoliter (NR/hl) increased by 5.3%. In Brazil, volumes grew by 2.6%, while NR/hl was down 1.9%. In CAC, while organic volumes were up 1.2% with a NR/hl growth of 3.4%, reported volumes increased by 27.3%, as a result of the swap of assets carried out with ABI and our operations in Panama. In LAS, volumes increased by 3.1% and NR/hl was up 23.3%, reflecting the high inflation in the region. In Canada, volumes were slightly down (-0.9%), with a solid 3.3% NR/hl growth. Cost of Goods Sold (COGS): Our COGS increased by 26.4% in 1Q17 while, on a per hectoliter basis, it grew by 23.1%, mainly due to inflationary pressures and unfavorable currency in Brazil and LAS. Selling, General & Administrative (SG&A) expenses: SG&A (excluding depreciation and amortization) in 1Q17 was up 6.4%, with efficiency gains in non working money and cost savings in working money. EBITDA, Gross margin and EBITDA margin: Normalized EBITDA reached R$ 4,356 million (-7.6%) in 1Q17 with gross margin of 59.8% (-580bps) and EBITDA margin of 38.7% (-670bps). Normalized Net Profit and EPS: Normalized Net Profit was R$ 2,316 million in 1Q17, 20.1% below 1Q16, driven mainly by a lower EBITDA and currency translation due to the appreciation of the Brazilian Real. Normalized EPS in the quarter was R$ 0.14. Operating Cash Generation and CAPEX: Cash generated from operations in 1Q17 was R$ 3.1 billion versus R$ 2.3 billion in 1Q16 (+37.7%). In the quarter, CAPEX reached R$ 559 million, 20.9% lower than in 1Q16. Other cash gains: We have recorded in our Equity a cash gain of R$ 159 million, related to the recovery of restricted funds, to be received in 36 installments as of January, 2017. Pay-out and Financial discipline: In 1Q17, we returned approximately R$ 1.1 billion to equity holders in

  • dividends. As of March 31st, 2017, our net cash position was R$ 2,106 million.

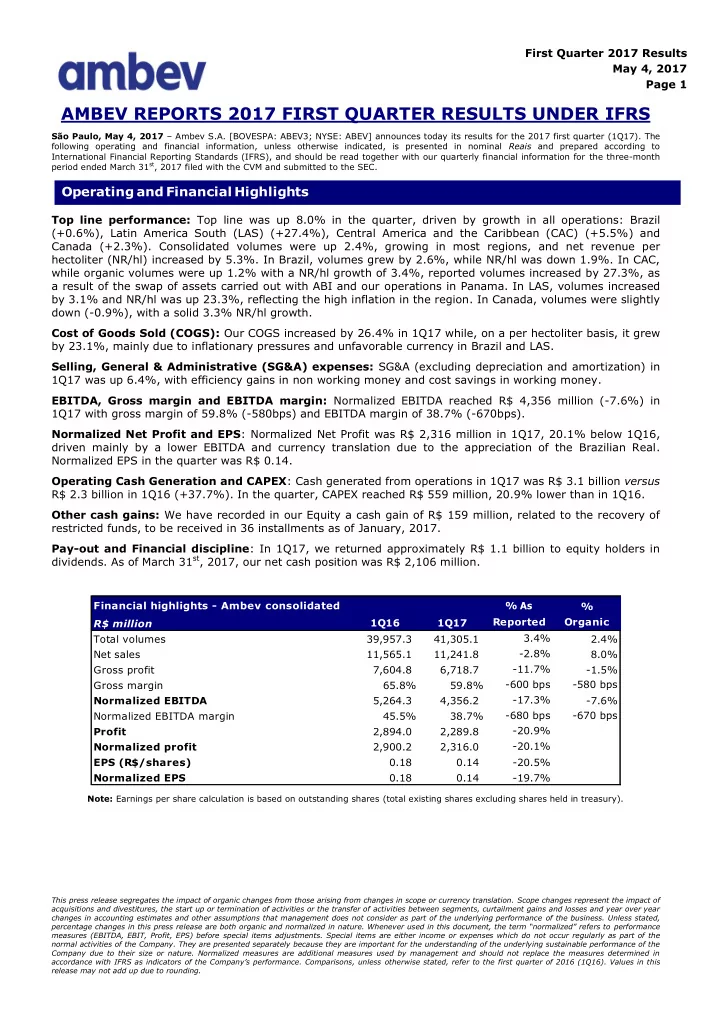
Note: Earnings per share calculation is based on outstanding shares (total existing shares excluding shares held in treasury).

Operating and Financial Highlights

Financial highlights - Ambev consolidated % As % R$ million 1Q16 1Q17 Reported Organic Total volumes 39,957.3 41,305.1 3.4% 2.4% Net sales 11,565.1 11,241.8

  • 2.8%

8.0% Gross profit 7,604.8 6,718.7

  • 11.7%
  • 1.5%

Gross margin 65.8% 59.8%

  • 600 bps
  • 580 bps

Normalized EBITDA 5,264.3 4,356.2

  • 17.3%
  • 7.6%

Normalized EBITDA margin 45.5% 38.7%

  • 680 bps
  • 670 bps

Profit 2,894.0 2,289.8

  • 20.9%

Normalized profit 2,900.2 2,316.0

  • 20.1%

EPS (R$/shares) 0.18 0.14

  • 20.5%

Normalized EPS 0.18 0.14

  • 19.7%
slide-2
SLIDE 2

First Quarter 2017 Results May 4, 2017 Page 2 We started the year with net revenue going up 8.0% and EBITDA down 7.6%, driven by solid results in CAC, LAS and Canada but negatively impacted by Brazil’s performance. As anticipated, our EBITDA decline in Brazil is explained by temporary headwinds: (i) the increase of our COGS mainly driven by negative effect of the FX, and (ii) a tough comparable of NR/hl, due to state taxes increases imposed towards the end of February 2016. On the other hand, whilst the consumer market in Brazil remains challenging, leading to the beer industry decline of low single digit, we have been able to revert the negative trend and grow our beer volumes by 3.4%. Our beer volumes performance represents a good first step towards our objective of resuming top line and EBITDA growth and benefited from our strong execution through our five commercial platforms:  Elevate the Core

  • Skol and Antarctica boosted summer experiences and took a leading role during Carnival,

sponsoring the street Carnival in more than 40 cities and engaging with more than 35 million people through a complete 360 activation.

  • We have just launched a new visual brand identity (VBI) for Brahma, our classic lager, to

highlight the brand’s attributes of flavor and beer expertise. Its gold and red colors are still there, but in a totally new design inspired in its old VBIs, evoking its tradition.  Accelerate Premium

  • Our domestic and global portfolios of premium brands have delivered another quarter of solid

performance, with volumes increasing double digits, led by Budweiser that grew more than 30% year over year.

  • Stella Artois launched a global campaign “Buy a Lady a Drink”, in partnership with the

Water.org, to help raise awareness of the global water crisis, inviting its core targets consumers to leave a legacy.  Near Beer

  • Our strong activation during Carnival has been supported by Skol Beats, with its three

variants, Senses, Spirits and Secret.

  • Going forward, there is still a big opportunity for Near Beer, as we increase our portfolio and

capture a bigger share of throat in non-traditional beer occasions.  In Home

  • We have been expanding our market programs designed to improve the assortment of

products and category space, enhancing shoppers experience in the off-trade channel.

  • The 300ml returnable glass bottles continue to be a big focus for 2017, driving affordability to
  • consumers. This presentation grew double digits year over year.

 Out of Home

  • The bar is an extension of the Brazilian’s living rooms. We have been improving execution and

service level across the country and investing in trade programs to support the points of sales in the challenging macro environment.

  • The 1 liter returnable glass bottles grew high single digit year over year, playing an important

role in such environment. In CSD & NANC Brazil, we continued to invest behind our brands and to strengthen our pack price strategy, delivering flattish volumes, while the industry came under significant pressure declining, as per our estimates, high single digit. In our international operations, CAC delivered another quarter of organic volumes growth and solid revenue management strategy that, coupled with a solid cost discipline, led to an EBITDA increase and margin

  • expansion. In LAS, the weakness in soft drink industry was more than offset by an strong beer volumes

performance in all the countries we operate, leading to solid EBITDA growth. And in Canada, we continued to grow our top line and EBITDA driven by organic volumes growth and strong revenue management strategy.

Management Comments

slide-3
SLIDE 3

First Quarter 2017 Results May 4, 2017 Page 3 Still with respect to our international operations, it is important to highlight that our reported results include for the first time our operations in Panama and exclude our former operations in Colombia, Peru and Ecuador, which are treated as a scope in our CAC as LAS divisions, respectively. Looking at our divisional performance highlights in more detail: 

  • Brazil. NR in Brazil was up 0.6% in 1Q17 and EBITDA down 23.8% to R$ 2,455 million, with a margin
  • f 39.0% (-1250bps).
  • In Beer Brazil, net revenue grew by 1.1% in 1Q17.
  • Total volumes increased by 3.4% in the quarter, despite the continued macroeconomic
  • weakness. We estimate that beer industry volumes declined low single digit. Premium

continued to grow, with volumes increasing double digits.

  • NR/hl was down 2.2%, due to a hard comparable in 1Q16, as the 2016 state taxes

increases only became effective towards the end of February 2016. In addition, as part of our revenue management strategy, we continued to use our full portfolio of packs and brands to drive affordability to consumers, including the 1 liter returnable glass bottles in the on-trade channel and the 300ml returnable glass bottles in the off- trade channel. Volumes of both packaging presentations grew double digits in the quarter.

  • In CSD & NANC Brazil, top line was down 2.6% in the quarter. Volumes were slightly up

(+0.1%), better than CSD industry that declined, as we estimate, high single digit, as consumers continue to be pressured by negative real disposable income growth. NR/hl in CSD & NANC was down 2.7%.

  • Brazil cash COGS was up 38.2% while, on a per hectoliter basis, 34.8%, mainly due to (i) FX

impacts, (ii) inflation, and (iii) a hard comparable in 1Q16, when our cash COGS/hl increased by 2.3%, despite of an inflation of around 10% and a FX impact of more than 20%.

  • Brazil cash SG&A was up 1.5%, below inflation, due to (i) a low single digit growth of

distribution and administrative expenses, and (ii) a decline in sales and marketing expenses driven by efficiency gains in non working money.  Central America and the Caribbean (CAC). In 1Q17, EBITDA in CAC reached R$ 377 million (+7.8%) driven by top line performance (+5.5%) and another quarter of EBITDA margin expansion (+80bps) to 35.6%. In US dollars, reported EBITDA grew close to 25%.

  • We continued to experience a good momentum of top line growth in the region. Organic

volumes grew by 1.2% on a tough comparable, given the 10.4% volume growth in 1Q16 while, on a reported basis, volumes increased by 27.3% benefitting from the recent swap of assets carried out with ABI and our operations in Panama. In Dominican Republic, we continued to connect with our consumers through relevant platforms, such as Carnival Presidente and The World Baseball Classic, supporting the equity of our brands, while, in Guatemala, we further improved our execution, with strong summer activation of Corona and Busch.  Latin America South (LAS). In 1Q17, top line was up 27.4%, and EBITDA in the region reached R$ 1,203 million (+20.5%) with an EBITDA margin compression of 250bps to 43.5%.

  • Volumes were up 3.1%, as the softness of the CSD&NANC industry in the region was more

than offset by a strong performance of beer in (i) Argentina, where volumes reverted the recent negative trend and increased by a high single digit, leaded by Brahma, Iguana and Corona; (ii) Bolivia, driven by Huari; (iii) Paraguay, with an outperformance of Brahma, Bud Light and Ouro Fino; (iv) Chile, with strong performance of our Global Brands; and (v) Uruguay, with a double digits volume growth. EBITDA margin in LAS compressed 250bps in the quarter mainly due to a 41.8% cash COGS increase (+35.0% on a hectoliter basis) impacted by FX in Argentina. 

  • Canada. EBITDA for the country totaled R$ 321 million (+17.5%) driven by top line growth (+2.3%)

and continued cost discipline to drive robust EBITDA margin expansion (+370bps) to 28.5%.

slide-4
SLIDE 4

First Quarter 2017 Results May 4, 2017 Page 4

  • We delivered another quarter of solid top line performance in Canada, with NR/hl growing

3.3% mainly as a result of our revenue management strategy. Volumes were down 0.9% in 1Q17, due to Easter holiday phasing impact on the beer industry, partially offset by the continued growth of our Global Brands, led by Bud Light and Stella Artois, and strong performance from our craft and near beer portfolio, which are growing double digits. We are confident that the initiatives taken under our commercial platforms have played an important role for the recovery of beer volumes in Brazil. However, it is important to keep in mind that the macro environment remains very challenging, with an all- time high unemployment rate and depressed disposable income, what is leading to a continued decline of the beer industry. In this context, we remain cautiously optimistic for the year and we will continue to leverage our commercial platforms. We will also keep pursuing efficiency in our investments and, despite the short-term negative impact of our COGS, as part of our culture, we will push ourselves further to improve our cost performance and deliver superior results, as we remain excited with the opportunities we see going forward to resume top line and EBITDA growth. We reiterate our guidance that we expect cash COGS/hl to grow double digits in the first half and to be flattish to low single digit up in the second half of 2017. Further, year over year, the increase of the cash COGS/hl in 2Q17 will be significantly lower than the year over year increase in 1Q17, being a bridge for second half of the year. Finally, regarding our international operations, in CAC, we will keep pursuing top line growth and EBITDA margin expansion and we remain enthusiastic with the region. In LAS, we are excited with the positive volumes trend and top line growth opportunities, especially for beer, whilst still cautious with the macro environment in Argentina. In Canada, we continue to focus on balanced top line growth translating into the bottom line and remain optimistic that we have the right portfolio to deliver profitable growth.

Outlook

slide-5
SLIDE 5

First Quarter 2017 Results May 4, 2017 Page 5

Ambev Consolidated Income Statement

Consolidated income statement % As % R$ million Scope 1Q17 Reported Organic Net revenue 11,565.1 135.8 (1,373.1) 914.0 11,241.8

  • 2.8%

8.0% Cost of goods sold (COGS) (3,960.3) (28.0) 494.7 (1,029.5) (4,523.1) 14.2% 26.4% Gross profit 7,604.8 107.8 (878.4) (115.5) 6,718.7

  • 11.7%
  • 1.5%

Selling, general and administrative (SG&A) (3,596.6) (59.7) 379.0 (203.6) (3,480.9)

  • 3.2%

5.7% Other operating income 392.3 13.2 0.1 (114.8) 290.8

  • 25.9%
  • 29.2%

Normalized operating income (normalized EBIT) 4,400.5 61.4 (499.4) (433.9) 3,528.6

  • 19.8%
  • 9.8%

Exceptional items above EBIT (6.2) (6.6) 4.5 (20.3) (28.7) nm nm Net finance results (1,171.3) (872.6)

  • 25.5%

Share of results of associates 7.4 1.0

  • 86.1%

Income tax expense (336.4) (338.5) 0.6% Profit 2,894.0 2,289.8

  • 20.9%

Attributable to Ambev holders 2,766.9 2,199.1

  • 20.5%

Attributable to non-controlling interests 127.1 90.7

  • 28.7%

Normalized profit 2,900.2 2,316.0

  • 20.1%

Attributable to Ambev holders 2,773.1 2,225.3

  • 19.8%

Normalized EBITDA 5,264.3 71.1 (575.7) (403.6) 4,356.2

  • 17.3%
  • 7.6%

1Q16 Currency Translation Organic Growth

slide-6
SLIDE 6

First Quarter 2017 Results May 4, 2017 Page 6 The combination of Ambev’s operations in Latin America North (LAN), LAS and Canada’s business units, eliminating intercompany transactions, comprises our consolidated financial statements. The figures shown below are on an as-reported basis.

Volume (million hectoliters) Net revenues per HL (R$) COGS per HL (R$) Normalized EBITDA (R$ MM) Normalized EBITDA margin (%)

Ambev Consolidated Results

43.0 43.2 40.0 41.3

10 20 30 40 50 1Q14 1Q15 1Q16 1Q17 210.4 249.4 289.4 272.2 50 100 150 200 250 300 350 1Q14 1Q15 1Q16 1Q17 70.0 83.7 99.1 109.5 10 30 50 70 90 110 130 1Q14 1Q15 1Q16 1Q17 4,051.0 5,072.9 5,264.3 4,356.2 1000 2000 3000 4000 5000 6000 1Q14 1Q15 1Q16 1Q17 44.8% 47.1% 45.5% 38.7% 0% 10% 20% 30% 40% 50% 60% 1Q14 1Q15 1Q16 1Q17

slide-7
SLIDE 7

First Quarter 2017 Results May 4, 2017 Page 7 We delivered during the quarter R$ 11,241.8 million of Net Revenue (+8.0%) and R$ 4,356.2 million of Normalized EBITDA (-7.6%).

Ambev Consolidated

Ambev results % As % R$ million Scope 1Q17 Reported Organic Volume ('000 hl) 39,957.3 383.0

  • 964.8

41,305.1 3.4% 2.4% Net revenue 11,565.1 135.8 (1,373.1) 914.0 11,241.8

  • 2.8%

8.0%

Net revenue/hl 289.4 0.6 (33.2) 1 5.4 272.2

  • 6.0%

5.3% COGS (3,960.3) (28.0) 494.7 (1,029.5) (4,523.1) 14.2% 26.4%

COGS/hl (99.1 ) 0.2 1 2.0 (22.6) (1 09.5)

10.5% 23.1% COGS excl. deprec.&amort. (3,403.3) (24.2) 446.2 (994.9) (3,976.1) 16.8% 29.7%

COGS/hl excl. deprec. &amort (85.2) 0.2 1 0.8 (22.1 ) (96.3)

13.0% 26.2% Gross profit 7,604.8 107.8 (878.4) (115.5) 6,718.7

  • 11.7%
  • 1.5%

Gross margin 65.8% 59.8%

  • 600 bps
  • 580 bps

SG&A excl. deprec.&amort. (3,289.8) (53.8) 351.1 (207.9) (3,200.3)

  • 2.7%

6.4% SG&A deprec.&amort. (306.9) (5.9) 27.9 4.3 (280.6)

  • 8.6%
  • 1.4%

SG&A total (3,596.6) (59.7) 379.0 (203.6) (3,480.9)

  • 3.2%

5.7% Other operating income 392.3 13.2 0.1 (114.8) 290.8

  • 25.9%
  • 29.2%

Normalized EBIT 4,400.5 61.4 (499.4) (433.9) 3,528.6

  • 19.8%
  • 9.8%

Normalized EBIT margin 38.0% 31.4%

  • 660 bps
  • 640 bps

Normalized EBITDA 5,264.3 71.1 (575.7) (403.6) 4,356.2

  • 17.3%
  • 7.6%

Normalized EBITDA margin 45.5% 38.7%

  • 680 bps
  • 670 bps

Currency Translation Organic Growth 1Q16

slide-8
SLIDE 8

First Quarter 2017 Results May 4, 2017 Page 8 Our LAN region includes Beer Brazil, CSD & NANC Brazil and Central America and the Caribbean (CAC)

  • perations. LAN EBITDA for the quarter totaled R$ 2,832.0 million (-20.5%).

Latin America North (LAN)

LAN results % As % R$ million Scope 1Q17 Reported Organic Volume ('000 hl) 29,000.7 573.0

  • 712.7

30,286.4 4.4% 2.5% Net revenue 7,275.7 218.6 (234.3) 92.1 7,352.1 1.1% 1.3%

Net revenue/hl 250.9 2.5 (7.7) (2.9) 242.8

  • 3.2%
  • 1.2%

COGS (2,484.8) (86.7) 103.9 (660.8) (3,128.4) 25.9% 26.6%

COGS/hl (85.7) (1 .3) 3.4 (1 9.8) (1 03.3)

20.6% 23.1% COGS excl. deprec.&amort. (2,061.0) (75.5) 90.6 (658.0) (2,703.9) 31.2% 31.9%

COGS/hl excl. deprec. &amort (71 .1 ) (1 .2) 3.0 (20.0) (89.3)

25.6% 28.2% Gross profit 4,790.8 131.9 (130.4) (568.7) 4,223.6

  • 11.8%
  • 11.9%

Gross margin 65.8% 57.4%

  • 840 bps
  • 850 bps

SG&A excl. deprec.&amort. (2,041.2) (95.1) 52.5 (20.6) (2,104.3) 3.1% 1.0% SG&A deprec.&amort. (218.0) (11.0) 6.4 0.8 (221.7) 1.7%

  • 0.4%

SG&A total (2,259.1) (106.1) 58.9 (19.7) (2,326.1) 3.0% 0.9% Other operating income 426.5 11.5 0.6 (150.4) 288.2

  • 32.4%
  • 35.3%

Normalized EBIT 2,958.2 37.3 (70.9) (738.8) 2,185.8

  • 26.1%
  • 25.0%

Normalized EBIT margin 40.7% 29.7% -1100 bps -1060 bps Normalized EBITDA 3,600.1 59.4 (90.6) (736.8) 2,832.0

  • 21.3%
  • 20.5%

Normalized EBITDA margin 49.5% 38.5% -1100 bps -1060 bps Currency Translation Organic Growth 1Q16

slide-9
SLIDE 9

First Quarter 2017 Results May 4, 2017 Page 9 In 1Q17 we delivered R$ 2,455.1 million (-23.8%) of Normalized EBITDA in Brazil, with an EBITDA margin of 39.0% (-1250bps). Net revenue increased by 0.6% in the quarter, with volumes going up 2.6% and a NR/hl down 1.9%. Cash COGS and cash COGS/hl were up 38.2% and 34.8%, respectively. Cash SG&A grew 1.5%.

Ambev Brazil

Ambev Brazil results % As % R$ million Scope 1Q17 Reported Organic Volume ('000 hl) 26,808.1

  • 686.4

27,494.5 2.6% 2.6% Net revenue 6,258.1

  • 36.1

6,294.2 0.6% 0.6%

Net revenue/hl 233.4

  • (4.5)

228.9

  • 1.9%
  • 1.9%

COGS (2,013.0)

  • (651.5)

(2,664.5) 32.4% 32.4%

COGS/hl (75.1 )

  • (21

.8) (96.9)

29.1% 29.1% COGS excl. deprec.&amort. (1,662.2)

  • (635.3)

(2,297.5) 38.2% 38.2%

COGS/hl excl. deprec. &amort (62.0)

  • (21

.6) (83.6)

34.8% 34.8% Gross profit 4,245.1

  • (615.4)

3,629.7

  • 14.5%
  • 14.5%

Gross margin 67.8% 57.7% -1010 bps -1010 bps SG&A excl. deprec.&amort. (1,794.5)

  • (27.3)

(1,821.8) 1.5% 1.5% SG&A deprec.&amort. (197.2)

  • 9.1

(188.2)

  • 4.6%
  • 4.6%

SG&A total (1,991.7)

  • (18.2)

(2,009.9) 0.9% 0.9% Other operating income 419.9

  • (139.7)

280.2

  • 33.3%
  • 33.3%

Normalized EBIT 2,673.2

  • (773.3)

1,899.9

  • 28.9%
  • 28.9%

Normalized EBIT margin 42.7% 30.2% -1250 bps -1250 bps Normalized EBITDA 3,221.3

  • (766.2)

2,455.1

  • 23.8%
  • 23.8%

Normalized EBITDA margin 51.5% 39.0% -1250 bps -1250 bps Currency Translation Organic Growth 1Q16

slide-10
SLIDE 10

First Quarter 2017 Results May 4, 2017 Page 10 In 1Q17, EBITDA for Beer Brazil was R$ 2,214.9 million (-20.1%) with an EBITDA margin compression of 1100bps to 41.2%. NR was up 1.1% in the quarter, as volumes growth of 3.4% was partially impacted by a negative NR/hl (- 2.2%), driven by (i) a hard comparable in 1Q16, as the 2016 state taxes increases only became effective towards the end of February 2016, and (ii) negative mix. Cash COGS/hl increased by 34.3%, driven by (i) FX impacts, (ii) inflation, and (iii) a hard comparable in 1Q16, when our cash COGS/hl increased by 2.9%, despite of an inflation of around 10% and a FX impact of more than 20%. Cash SG&A was flattish due to (i) a below inflation growth of sales and marketing, driven by efficiency gains in our non working money, and (ii) a low single digit increase in distribution costs and a decline in administrative costs, as a result of the revision of our logistics and administrative cost allocation between Beer and CSD & NANC businesses.

Beer Brazil

Beer Brazil results % As % R$ million Scope 1Q17 Reported Organic Volume ('000 hl) 19,867.5

  • 681.7

20,549.2 3.4% 3.4% Net revenue 5,309.9

  • 60.6

5,370.5 1.1% 1.1%

Net revenue/hl 267.3

  • (5.9)

261 .3

  • 2.2%
  • 2.2%

COGS (1,599.4)

  • (514.5)

(2,113.9) 32.2% 32.2%

COGS/hl (80.5)

  • (22.4)

(1 02.9)

27.8% 27.8% COGS excl. deprec.&amort. (1,297.5)

  • (504.3)

(1,801.7) 38.9% 38.9%

COGS/hl excl. deprec. &amort (65.3)

  • (22.4)

(87.7)

34.3% 34.3% Gross profit 3,710.5

  • (453.9)

3,256.6

  • 12.2%
  • 12.2%

Gross margin 69.9% 60.6%

  • 930 bps
  • 930 bps

SG&A excl. deprec.&amort. (1,576.8)

  • 0.2

(1,576.6) 0.0% 0.0% SG&A deprec.&amort. (159.1)

  • (8.6)

(167.7) 5.4% 5.4% SG&A total (1,736.0)

  • (8.4)

(1,744.3) 0.5% 0.5% Other operating income 336.8

  • (114.0)

222.8

  • 33.8%
  • 33.8%

Normalized EBIT 2,311.3

  • (576.3)

1,735.0

  • 24.9%
  • 24.9%

Normalized EBIT margin 43.5% 32.3% -1120 bps -1120 bps Normalized EBITDA 2,772.3

  • (557.4)

2,214.9

  • 20.1%
  • 20.1%

Normalized EBITDA margin 52.2% 41.2% -1100 bps -1100 bps Currency Translation Organic Growth 1Q16

slide-11
SLIDE 11

First Quarter 2017 Results May 4, 2017 Page 11 In Brazil CSD & NANC, we delivered an EBITDA of R$ 240.2 million (-46.5%) in the 1Q17, with an EBITDA margin of 26.0% (-2130bps). Net revenue was down (-2.6%), as a flattish volumes (+0.1%) were impacted by a NR/hl decline of 2.7%. Cash COGS/hl increased by 35.8% driven by (i) negative FX impacts, (ii) inflation, and (iii) a hard comparable in 1Q16, when cash COGS/hl increased by 1.1%, despite of an inflation of around 10% and a FX impact of more than 20%. Cash SG&A was up 12.6% driven by a double digits decline in sales and marketing impacted by higher distribution and administrative expenses, due to the revision of our cost allocation between our businesses to better reflect the CSD & NANC operations.

CSD & NANC Brazil

CSD&Nanc Brazil results % As % R$ million Scope 1Q17 Reported Organic Volume ('000 hl) 6,940.6

  • 4.7

6,945.3 0.1% 0.1% Net revenue 948.2

  • (24.5)

923.7

  • 2.6%
  • 2.6%

Net revenue/hl 1 36.6

  • (3.6)

1 33.0

  • 2.7%
  • 2.7%

COGS (413.6)

  • (137.0)

(550.6) 33.1% 33.1%

COGS/hl (59.6)

  • (1

9.7) (79.3)

33.0% 33.0% COGS excl. deprec.&amort. (364.7)

  • (131.1)

(495.8) 35.9% 35.9%

COGS/hl excl. deprec. &amort (52.5)

  • (1

8.8) (71 .4)

35.8% 35.8% Gross profit 534.6

  • (161.5)

373.1

  • 30.2%
  • 30.2%

Gross margin 56.4% 40.4% -1600 bps -1600 bps SG&A excl. deprec.&amort. (217.7)

  • (27.5)

(245.1) 12.6% 12.6% SG&A deprec.&amort. (38.1)

  • 17.6

(20.5)

  • 46.3%
  • 46.3%

SG&A total (255.8)

  • (9.8)

(265.6) 3.8% 3.8% Other operating income 83.1

  • (25.8)

57.4

  • 31.0%
  • 31.0%

Normalized EBIT 362.0

  • (197.1)

164.9

  • 54.4%
  • 54.4%

Normalized EBIT margin 38.2% 17.9% -2030 bps -2030 bps Normalized EBITDA 449.0

  • (208.8)

240.2

  • 46.5%
  • 46.5%

Normalized EBITDA margin 47.3% 26.0% -2130 bps -2130 bps Currency Translation Organic Growth 1Q16

slide-12
SLIDE 12

First Quarter 2017 Results May 4, 2017 Page 12 Our operations in CAC delivered an EBITDA of R$ 376.9 million (+7.8%) in the quarter, with an EBITDA margin of 35.6% (+80bps). In US dollars, reported EBITDA grew close to 25%. Top line increased by 5.5% in 1Q17 driven by organic volume growth (+1.2%), despite a tough comparable in 1Q16, when volumes grew 10.4%, and by a NR/hl increase of 3.4%. Reported volumes increased by 27.3%, benefitting from the recent swap of assets carried out with ABI and our operations in Panama. In Dominican Republic, we continued to connect with our consumers through relevant platforms, such as Carnival Presidente and The World Baseball Classic, enhancing our brand’s equity, while, in Guatemala, we improved

  • ur execution, with a strong summer activation of Corona and Busch.

Cash COGS/hl grew in line with top line performance, while our cash SG&A declined 2.7%, driving another quarter of EBITDA margin expansion. The scope change in CAC refers to the beginning of our operations in Panama as a result of the swap of assets carried out with ABI on December 31, 2016.

CAC results % As % R$ million Scope 1Q17 Reported Organic Volume total ('000 hl) 2,192.6 573.0

  • 26.3

2,791.9 27.3% 1.2% Net revenue 1,017.6 218.6 (234.3) 56.0 1,057.9 4.0% 5.5%

Net revenue/hl 464.1 (1 7.1 ) (83.9) 1 5.9 378.9

  • 18.4%

3.4% COGS (471.8) (86.7) 103.9 (9.3) (463.9)

  • 1.7%

2.0%

COGS/hl (21 5.2) 1 3.3 37.2 (1 .4) (1 66.2)

  • 22.8%

0.7% COGS excl. deprec.&amort. (398.8) (75.5) 90.6 (22.7) (406.4) 1.9% 5.7%

COGS/hl excl. deprec. &amort (1 81 .9) 1 0.4 32.4 (6.5) (1 45.6)

  • 20.0%

3.6% Gross profit 545.7 131.9 (130.4) 46.7 593.9 8.8% 8.6% Gross margin 53.6% 56.1% 250 bps 160 bps SG&A excl. deprec.&amort. (246.7) (95.1) 52.5 6.7 (282.6) 14.6%

  • 2.7%

SG&A deprec.&amort. (20.7) (11.0) 6.4 (8.2) (33.5) 61.7% 39.7% SG&A total (267.4) (106.1) 58.9 (1.5) (316.1) 18.2% 0.6% Other operating income/expenses 6.7 11.5 0.6 (10.7) 8.1 21.3%

  • 160.1%

Normalized EBIT 285.0 37.3 (70.9) 34.5 285.9 0.3% 12.1% Normalized EBIT margin 28.0% 27.0%

  • 100 bps

180 bps Normalized EBITDA 378.8 59.4 (90.6) 29.4 376.9

  • 0.5%

7.8% Normalized EBITDA margin 37.2% 35.6%

  • 160 bps

80 bps 1Q16 Currency Translation Organic Growth

Central America and the Caribbean (CAC)

slide-13
SLIDE 13

First Quarter 2017 Results May 4, 2017 Page 13 LAS EBITDA increased by 20.5% in 1Q17 to R$ 1,203.4 million, with an EBITDA margin of 43.5% (-250bps). Our volumes grew by 3.1%, as the softness of the CSD&NANC industry in the region was more than offset by a strong performance of beer in (i) Argentina, where volumes reverted the recent negative trend and increased by a high single digit, with great contribution from Brahma, Iguana and Corona; (ii) Bolivia, mainly driven by Huari; (iii) Paraguay, with an outperformance of Brahma, Bud Light and Ouro Fino; (iv) Chile, with strong performance of our Global Brands; and (v) Uruguay, with a double digits volume growth driven by both mainstream and premium portfolios. Top line was up 27.4% with a NR/hl increase of 23.3%. Cash COGS grew 41.8% while, on a hectoliter basis, 35.0%, mainly driven by higher inflation and negative currency impact, as we are very systematic with our hedge policy. Cash SG&A increased by 27.7%, adversely impacted by inflationary pressures mainly in Argentina. The scope change in LAS refers to the termination of our operations in Colombia, Peru and Ecuador as a result

  • f the swap of assets carried out with ABI on December 31st, 2016.

Latin America South (LAS)

LAS results % As % R$ million Scope 1Q17 Reported Organic Volume ('000 hl) 9,017.0 (197.3)

  • 269.8

9,089.5 0.8% 3.1% Net revenue 2,973.9 (87.8) (913.4) 791.3 2,764.0

  • 7.1%

27.4%

Net revenue/hl 329.8 2.6 (1 00.5) 77.3 304.1

  • 7.8%

23.3% COGS (1,044.3) 61.1 323.9 (400.6) (1,059.9) 1.5% 40.7%

COGS/hl (1 1 5.8) (4.3) 35.6 (40.8) (1 1 6.6)

0.7% 33.9% COGS excl. deprec.&amort. (941.2) 53.6 294.2 (370.7) (964.1) 2.4% 41.8%

COGS/hl excl. deprec. &amort (1 04.4) (3.7) 32.4 (37.8) (1 06.1 )

1.6% 35.0% Gross profit 1,929.6 (26.7) (589.5) 390.7 1,704.1

  • 11.7%

20.5% Gross margin 64.9% 61.7%

  • 320 bps
  • 350 bps

SG&A excl. deprec.&amort. (669.2) 45.1 199.2 (173.1) (598.0)

  • 10.6%

27.7% SG&A deprec.&amort. (70.3) 5.1 21.8 (17.0) (60.4)

  • 14.1%

26.0% SG&A total (739.5) 50.3 221.0 (190.0) (658.3)

  • 11.0%

27.6% Other operating income/expenses (27.7) 1.3 (0.4) 28.3 1.4

  • 105.2%
  • 107.1%

Normalized EBIT 1,162.3 24.8 (368.9) 228.9 1,047.2

  • 9.9%

19.3% Normalized EBIT margin 39.1% 37.9%

  • 120 bps
  • 260 bps

Normalized EBITDA 1,335.7 12.3 (420.5) 275.8 1,203.4

  • 9.9%

20.5% Normalized EBITDA margin 44.9% 43.5%

  • 140 bps
  • 250 bps

Currency Translation Organic Growth 1Q16

slide-14
SLIDE 14

First Quarter 2017 Results May 4, 2017 Page 14 In Canada, we delivered R$ 320.8 million of EBITDA (+17.5%), while our EBITDA margin increased 370bps to 28.5%. In the first quarter our volumes were down 0.9% mostly due to contraction of the Canadian beer industry, which was impacted by Easter holiday phasing, partially offset by performance ahead of trend of our lead brand Budweiser, double digits growth on Bud Light, and continued strong performance from the craft and near beer portfolio. Our net revenue per hectoliter increased by 3.3%, mainly explained by our revenue management initiatives. Cash COGS decreased by 8.4% while, on a per hectoliter basis, by 7.6%, primarily driven by cost absorption with increased production and cost efficiencies with our import portfolio from ABI, while Cash SG&A expenses increased by 2.5%.

Canada

Canada results % As % R$ million Scope 1Q17 Reported Organic Volume ('000 hl) 1,939.6 7.3

  • (17.6)

1,929.2

  • 0.5%
  • 0.9%

Net revenue 1,315.6 5.0 (225.4) 30.6 1,125.8

  • 14.4%

2.3%

Net revenue/hl 678.3 0.0 (1 1 6.8) 22.0 583.5

  • 14.0%

3.3% COGS (431.2) (2.4) 66.9 31.9 (334.8)

  • 22.4%
  • 7.4%

COGS/hl (222.3) (0.4) 34.7 1 4.5 (1 73.6)

  • 21.9%
  • 6.5%

COGS excl. deprec.&amort. (401.2) (2.3) 61.5 33.8 (308.1)

  • 23.2%
  • 8.4%

COGS/hl excl. deprec. &amort (206.8) (0.4) 31 .9 1 5.6 (1 59.7)

  • 22.8%
  • 7.6%

Gross profit 884.4 2.6 (158.6) 62.5 790.9

  • 10.6%

7.1% Gross margin 67.2% 70.3% 310 bps 310 bps SG&A excl. deprec.&amort. (579.4) (3.8) 99.4 (14.2) (498.0)

  • 14.0%

2.5% SG&A deprec.&amort. (18.6) (0.0) (0.3) 20.4 1.5

  • 108.2%
  • 110.0%

SG&A total (598.0) (3.8) 99.1 6.2 (496.5)

  • 17.0%
  • 1.0%

Other operating income/expenses (6.5) 0.5 (0.1) 7.3 1.2

  • 117.8%
  • 112.6%

Normalized EBIT 279.9 (0.7) (59.6) 76.0 295.6 5.6% 27.1% Normalized EBIT margin 21.3% 26.3% 500 bps 510 bps Normalized EBITDA 328.6 (0.6) (64.6) 57.4 320.8

  • 2.4%

17.5% Normalized EBITDA margin 25.0% 28.5% 350 bps 370 bps Currency Translation Organic Growth 1Q16

slide-15
SLIDE 15

First Quarter 2017 Results May 4, 2017 Page 15 Other operating income totaled R$ 290.8 million in 1Q17 (-25.9%), mainly driven by government grants related to State VAT long-term tax incentives that were down year over year due to (i) the expiration of VAT Government Grants Agreements in 4Q16, and (ii) revenue geographic mix. During the first quarter we recorded an expense of R$ 28.7 million in exceptional items (as compared to R$ 6.2 million in 1Q16).

Other operating income/(expense)

Other operating income/(expenses) 1Q16 1Q17 R$ million Government grants/NPV

  • f

long term fiscal incentives 355.3 221.9 (Additions to)/reversals of provisions (22.2) (10.6) Net gain on disposal of property, plant and equipment and intangible assets 2.9 (5.4) Net other operating income/(expenses) 56.3 84.9 392.3 290.8 Exceptional items 1Q16 1Q17 R$ million Restructuring (6.2) (27.1) Costs of new acquisition

  • (0.7)

Other exceptional items

  • (0.8)

(6.2) (28.7) Exceptional items

slide-16
SLIDE 16

First Quarter 2017 Results May 4, 2017 Page 16 Net finance results declined 25.5% (a R$ 1,171.3 million expense in 1Q16 compared to a R$ 872.6 million expense in 1Q17), as a higher Interest Expenses of R$ 402.2 million, due to interest expenses and the non cash expense related to the put option associated with our investment in the Dominican Republic (around R$ 140 million), was more than offset by lower losses on: (i) Derivative instruments, driven by the carry cost of our FX hedges, primarily linked to our COGS exposure in Brazil and Argentina, and non-cash gains or losses related to the mark to market of the hedges; and (ii) Non-derivative instruments, related to foreign exchange translation on intercompany payables and loans, as we benefited from the BRL appreciation. As of March 31st, 2017 we held a net cash position of R$ 2,106.1 million (down from R$ 2,763.3 million as of December 31st, 2016). Consolidated debt corresponded to R$ 5,132.9 million whereas cash and cash equivalents less bank overdrafts totaled R$ 7,229.1 million, down from R$ 7,876.8 million as of December 31st, 2016.

Net finance results

Net finance results 1Q16 1Q17 R$ million Interest income 185.1 108.7 Interest expenses (361.0) (402.2) Gains/(losses) on derivative instruments (417.4) (246.6) Gains/(losses) on non-derivative instruments (245.3) (78.4) Taxes on financial transactions (43.3) (38.0) Other financial income/(expenses), net (289.4) (216.0) Net finance results (1,171.3) (872.6)

Debt Breakdown Current Non-current Total Current Non-current Total Local Currency 726.0 1,165.3 1,891.2 651.6 1,108.4 1,760.0 Foreign Currency 2,904.7 600.5 3,505.1 2,817.9 555.0 3,372.9 Consolidated Debt 3,630.6 1,765.7 5,396.3 3,469.5 1,663.4 5,132.9 Cash and Cash Equivalents less Bank Overdrafts 7,876.8 7,229.1 Current Investment Securities 282.8 9.9 Net Debt/ (Cash) (2,763.3) (2,106.1) December 31st, 2016 March 31st, 2017

slide-17
SLIDE 17

First Quarter 2017 Results May 4, 2017 Page 17 The weighted nominal tax rate for the quarter was 29.6%, compared to 30.9% of 1Q16, while the effective tax rate increased from 10.4% to 12.9%, mainly driven by lower benefits from interest on shareholders’ equity. The table below shows the reconciliation for income tax and social contribution provision. The table below summarizes Ambev S.A.’s shareholding structure as of March 31st, 2017.

Provision for income tax & social contribution

Income tax and social contribution R$ million 1Q16 1Q17 Profit before tax 3,230.4 2,628.3 Adjustment on taxable basis Non-taxable net financial and other income (130.0) (104.9) Goverment grants (VAT) (341.1) (434.4) Share of results of associates (7.4) (1.0) Expenses not deductible 260.4 90.0 Foreign profits taxed in Brazil 479.0 34.8 3,491.2 2,212.8 Aggregated weighted nominal tax rate 30.9% 29.6% Taxes – nominal rate (1,079.4) (655.5) Adjustment on tax expense Tax benefit - interest on shareholders' equity 693.3 284.4 Tax benefit - amortization on tax books 35.6 36.2 Other tax adjustments 14.1 (3.6) Income tax and social contribution expense (336.4) (338.5) Effective tax rate 10.4% 12.9%

Shareholding structure

ON %Outs Anheuser-Busch InBev 9,726,265,061 61.9% FAHZ 1,601,417,401 10.2% Market 4,375,218,611 27.9% Outstanding 15,702,901,073 100.0% Treasury 14,714,346 TOTAL 15,717,615,419 Free float BM&FBovespa 3,034,242,689 19.3% Free float NYSE 1,340,975,922 8.5% Ambev S.A.'s shareholding structure

slide-18
SLIDE 18

First Quarter 2017 Results May 4, 2017 Page 18 Both Normalized EBITDA and EBIT are measures used by Ambev’s management to measure the Company’s performance. Normalized EBITDA is calculated excluding from Profit the following effects: (i) Non-controlling interest, (ii) Income Tax expense, (iii) Share of results of associates, (iv) Net finance results, (v) Special items, and (vi) Depreciation & Amortization. Normalized EBITDA and EBIT are not accounting measures under accounting practices in Brazil, IFRS or the United States of America (US GAAP) and should not be considered as an alternative to Profit as a measure of

  • perational performance or an alternative to Cash Flow as a measure of liquidity. Normalized EBITDA and

EBIT do not have a standard calculation method and Ambev’s definition of Normalized EBITDA and EBIT may not be comparable to that of other companies.

Reconciliation between normalized EBITDA & profit

Reconciliation - Profit to EBITDA 1Q16 1Q17 Profit - Ambev holders 2,766.9 2,199.1 Non-controlling interest 127.1 90.7 Income tax expense 336.4 338.5 Profit before taxes 3,230.4 2,628.3 Share of results of associates (7.4) (1.0) Net finance results 1,171.3 872.6 Exceptional items 6.2 28.7 Normalized EBIT 4,400.5 3,528.6 Depreciation & amortization - total 863.9 827.6 Normalized EBITDA 5,264.3 4,356.2

slide-19
SLIDE 19

First Quarter 2017 Results May 4, 2017 Page 19

.

Speakers: Bernardo Paiva Chief Executive Officer Ricardo Rittes Chief Financial and Investor Relations Officer Language: English Date: May 4th, 2017 (Thursday) Time: 13:00 (Brasília time) 12:00 (EST) Phone number: US participants + 1 (844) 839-2182 International participants + 1 (412) 317-2503 Conference ID: Ambev

Please call 15 minutes prior to the beginning of the conference call. Webcast: The conference call will also be transmitted live through the Internet, available on Ambev’s website: http://webcast.engage-x.com/Cover.aspx?PlatformId=%2F094hWfyLrhniO%2F7Nu5CDA%3D%3D Playback: The conference call replay through internet will be available one hour after conclusion at Ambev’s website at the same link above. For Playback through telephone: participants calling from USA: +1 (877) 344-7529 / participants calling from

  • ther countries: +1 (412) 317-0088 / Code: 10106388 - enter "1" to start the playback.

For additional information, please contact the Investor Relations team: Nicole Brink André Thomaz (+55 11) 2122-1415 (+55 11) 2122-1414 nicole.brink@ambev.com.br andre.thomaz@ambev.com.br ir.ambev.com.br

Statements contained in this press release may contain information that is forward-looking and reflects management’s current view and estimates of future economic circumstances, industry conditions, company performance, and finance

  • results. Any statements, expectations, capabilities, plans and assumptions contained in this press release that do not

describe historical facts, such as statements regarding the declaration or payment of dividends, the direction of future

  • perations, the implementation of principal operating and financing strategies and capital expenditure plans, the factors or

trends affecting financial condition, liquidity or results of operations, are forward-looking statements within the meaning of the U.S. Private Securities Litigation Reform Act of 1995 and involve a number of risks and uncertainties. There is no guarantee that these results will actually occur. The statements are based on many assumptions and factors, including general economic and market conditions, industry conditions, and operating factors. Any changes in such assumptions or factors could cause actual results to differ materially from current expectations.

Q1 2017 Earnings Conference Call

slide-20
SLIDE 20

First Quarter 2017 Results May 4, 2017 Page 20

. Ambev - Segment financial information

Organic results 1Q16 1Q17 % 1Q16 1Q17 % 1Q16 1Q17 % Volumes (000 hl) 19,867.5 20,549.2 3.4% 6,940.6 6,945.3 0.1% 26,808.1 27,494.5 2.6% R$ million Net sales 5,309.9 5,370.5 1.1% 948.2 923.7

  • 2.6%

6,258.1 6,294.2 0.6% % of total 45.9% 47.8% 8.2% 8.2% 54.1% 56.0% COGS (1,599.4) (2,113.9) 32.2% (413.6) (550.6) 33.1% (2,013.0) (2,664.5) 32.4% % of total 40.4% 46.7% 10.4% 12.2% 50.8% 58.9% Gross profit 3,710.5 3,256.6

  • 12.2%

534.6 373.1

  • 30.2%

4,245.1 3,629.7

  • 14.5%

% of total 48.8% 48.5% 7.0% 5.6% 55.8% 54.0% SG&A (1,736.0) (1,744.3) 0.5% (255.8) (265.6) 3.8% (1,991.7) (2,009.9) 0.9% % of total 48.3% 50.1% 7.1% 7.6% 55.4% 57.7% Other operating income/(expenses) 336.8 222.8

  • 33.8%

83.1 57.4

  • 31.0%

419.9 280.2

  • 33.3%

% of total 85.8% 76.6% 21.2% 19.7% 107.0% 96.3% Normalized EBIT 2,311.3 1,735.0

  • 24.9%

362.0 164.9

  • 54.4%

2,673.2 1,899.9

  • 28.9%

% of total 52.5% 49.2% 8.2% 4.7% 60.7% 53.8% Normalized EBITDA 2,772.3 2,214.9

  • 20.1%

449.0 240.2

  • 46.5%

3,221.3 2,455.1

  • 23.8%

% of total 52.7% 50.8% 8.5% 5.5% 61.2% 56.4% % of net sales Net sales 100.0% 100.0% 100.0% 100.0% 100.0% 100.0% COGS

  • 30.1%
  • 39.4%
  • 43.6%
  • 59.6%
  • 32.2%
  • 42.3%

Gross profit 69.9% 60.6% 56.4% 40.4% 67.8% 57.7% SG&A

  • 32.7%
  • 32.5%
  • 27.0%
  • 28.8%
  • 31.8%
  • 31.9%

Other operating income/(expenses) 6.3% 4.1% 8.8% 6.2% 6.7% 4.5% Normalized EBIT 43.5% 32.3% 38.2% 17.9% 42.7% 30.2% Normalized EBITDA 52.2% 41.2% 47.3% 26.0% 51.5% 39.0% Per hectoliter - (R$/hl) Net sales 267.3 261.3

  • 2.2%

136.6 133.0

  • 2.7%

233.4 228.9

  • 1.9%

COGS (80.5) (102.9) 27.8% (59.6) (79.3) 33.0% (75.1) (96.9) 29.1% Gross profit 186.8 158.5

  • 15.1%

77.0 53.7

  • 30.3%

158.4 132.0

  • 16.6%

SG&A (87.4) (84.9)

  • 2.9%

(36.9) (38.2) 3.8% (74.3) (73.1)

  • 1.6%

Other operating income/(expenses) 17.0 10.8

  • 36.0%

12.0 8.3

  • 31.1%

15.7 10.2

  • 34.9%

Normalized EBIT 116.3 84.4

  • 27.4%

52.2 23.7

  • 54.5%

99.7 69.1

  • 30.7%

Normalized EBITDA 139.5 107.8

  • 22.8%

64.7 34.6

  • 46.5%

120.2 89.3

  • 25.7%

Ambev Brazil Beer Brazil CSD & NANC Brazil Total Ambev Brazil Ambev - Segment financial information Organic results 1Q16 1Q17 % 1Q16 1Q17 % 1Q16 1Q17 % 1Q16 1Q17 % Volumes (000 hl) 9,017.0 9,089.5 3.1% 2,192.6 2,791.9 1.2% 1,939.6 1,929.2

  • 0.9%

39,957.3 41,305.1 2.4% R$ million Net sales 2,973.9 2,764.0 27.4% 1,017.6 1,057.9 5.5% 1,315.6 1,125.8 2.3% 11,565.1 11,241.8 8.0% % of total 25.7% 24.6% 8.8% 9.4% 11.4% 10.0% 100.0% 100.0% COGS (1,044.3) (1,059.9) 40.7% (471.8) (463.9) 2.0% (431.2) (334.8)

  • 7.4%

(3,960.3) (4,523.1) 26.4% % of total 26.4% 23.4% 11.9% 10.3% 10.9% 7.4% 100.0% 100.0% Gross profit 1,929.6 1,704.1 20.5% 545.7 593.9 8.6% 884.4 790.9 7.1% 7,604.8 6,718.7

  • 1.5%

% of total 25.4% 25.4% 7.2% 8.8% 11.6% 11.8% 100.0% 100.0% SG&A (739.5) (658.3) 27.6% (267.4) (316.1) 0.6% (598.0) (496.5)

  • 1.0%

(3,596.6) (3,480.9) 5.7% % of total 20.6% 18.9% 7.4% 9.1% 16.6% 14.3% 100.0% 100.0% Other operating income/(expenses) (27.7) 1.4

  • 107.1%

6.7 8.1

  • 160.1%

(6.5) 1.2

  • 112.6%

392.3 290.8

  • 29.2%

% of total

  • 7.1%

0.5% 1.7% 2.8%

  • 1.7%

0.4% 100.0% 100.0% Normalized EBIT 1,162.3 1,047.2 19.3% 285.0 285.9 12.1% 279.9 295.6 27.1% 4,400.5 3,528.6

  • 9.8%

% of total 26.4% 29.7% 6.5% 8.1% 6.4% 8.4% 100.0% 100.0% Normalized EBITDA 1,335.7 1,203.4 20.5% 378.8 376.9 7.8% 328.6 320.8 17.5% 5,264.3 4,356.2

  • 7.6%

% of total 25.4% 27.6% 7.2% 8.7% 6.2% 7.4% 100.0% 100.0% % of net sales Net sales 100.0% 100.0% 100.0% 100.0% 100.0% 100.0% 100.0% 100.0% COGS

  • 35.1%
  • 38.3%
  • 46.4%
  • 43.9%
  • 32.8%
  • 29.7%
  • 34.2%
  • 40.2%

Gross profit 64.9% 61.7% 53.6% 56.1% 67.2% 70.3% 65.8% 59.8% SG&A

  • 24.9%
  • 23.8%
  • 26.3%
  • 29.9%
  • 45.5%
  • 44.1%
  • 31.1%
  • 31.0%

Other operating income/(expenses)

  • 0.9%

0.1% 0.7% 0.8%

  • 0.5%

0.1% 3.4% 2.6% Normalized EBIT 39.1% 37.9% 28.0% 27.0% 21.3% 26.3% 38.0% 31.4% Normalized EBITDA 44.9% 43.5% 37.2% 35.6% 25.0% 28.5% 45.5% 38.7% Per hectoliter - (R$/hl) Net sales 329.8 304.1 23.5% 464.1 378.9 3.5% 678.3 583.5 3.3% 289.4 272.2 5.3% COGS (115.8) (116.6) 35.2% (215.2) (166.2) 0.7% (222.3) (173.6)

  • 6.5%

(99.1) (109.5) 22.9% Gross profit 214.0 187.5 17.1% 248.9 212.7 5.9% 456.0 410.0 8.0% 190.3 162.7

  • 3.8%

SG&A (82.0) (72.4) 22.7% (122.0) (113.2)

  • 0.5%

(308.3) (257.4)

  • 0.1%

(90.0) (84.3) 3.1% Other operating income/(expenses) (3.1) 0.2 nm 3.0 2.9

  • 159.2%

(3.3) 0.6

  • 121.7%

9.8 7.0

  • 30.0%

Normalized EBIT 128.9 115.2 16.4% 130.0 102.4 9.7% 144.3 153.2 28.4% 110.1 85.4

  • 11.8%

Normalized EBITDA 148.1 132.4 17.4% 172.7 135.0 5.7% 169.4 166.3 18.6% 131.7 105.5

  • 9.7%

Operations Consolidated Canada Ambev Operations Operations LAS CAC

slide-21
SLIDE 21

First Quarter 2017 Results May 4, 2017 Page 21

CONSOLIDATED BALANCE SHEET

R$ million

Assets Current assets Cash and cash equivalents 7,230.3 7,876.8 Investment securities (CURRENT) 9.9 282.8 Derivative financial instruments (current assets) 175.2 196.7 Trade receivables (current) 3,267.4 4,368.1 Inventories 4,510.3 4,347.1 Income tax and social contributions receivable (current) 4,293.9 4,693.7 Other taxes receivable (current) 674.6 729.6 Other assets (current) 1,135.7 1,392.2 21,297.3 23,887.0 Non-current assets Investment securities 112.8 104.3 Derivative financial instruments (assets) 44.8 16.3 Trade receivables (non-current) 6.2

  • Income tax and social contributions receivable (non-current)
  • 4.5

Deferred tax assets 2,568.0 2,268.1 Other taxes receivable (non-current) 334.5 343.1 Other assets (non-current) 2,009.1 1,973.6 Employee benefits 33.2 33.5 Investments in associates 294.1 300.1 Property, plant and equipment 18,658.4 19,153.8 Intangible assets 5,099.0 5,245.9 Goodwill 30,276.5 30,511.2 59,436.6 59,954.4 Total assets 80,733.9 83,841.4 Equity and liabilities Current liabilities Trade payables (current) 9,863.0 10,868.8 Derivative financial instruments (current liabilities) 348.4 686.4 Interest-bearing loans and borrowings (current) 3,469.4 3,630.6 Bank overdrafts 1.1

  • Payroll and social security payables

751.0 686.6 Dividends and interest on shareholder´s equity payable 615.5 1,714.4 Income tax and social contribution payable (current) 933.8 904.2 Taxes and contributions payable (current) 2,143.2 3,378.2 Put option granted on subsidiary and other liabilities (current) 5,610.3 6,735.8 Provisions 168.5 168.6 23,904.2 28,773.6 Non-current liabilities Trade payables (non-current) 195.3 237.8 Derivative financial instruments (liabilities) 2.4 27.0 Interest-bearing loans and borrowings 1,663.4 1,765.7 Deferred tax liabilities 2,226.8 2,329.7 Taxes and contributions payable (non-current) 532.9 681.4 Put option granted on subsidiary and other liabilities (non-curre 599.8 471.8 Provisions (non-CURRENT) 843.3 765.4 Employee benefits (non CURRENT) 2,084.9 2,137.7 8,148.8 8,416.5 Total liabilities 32,053.0 37,190.1 Equity Issued capital 57,614.1 57,614.2 Reserves 64,227.3 64,230.0 Comprehensive income (77,195.9) (77,019.1) Retained earnings 2,199.3

  • Equity attributable to equity holders of Ambev

46,844.8 44,825.1 Non-controlling interests 1,836.1 1,826.2 Total Equity 48,680.9 46,651.3 Total equity and liabilities 80,733.9 83,841.4 March 31st, 2017 December 31st, 2016

slide-22
SLIDE 22

First Quarter 2017 Results May 4, 2017 Page 22

CONSOLIDATED STATEMENT OF OPERATIONS

R$ million

1Q17 1Q16 Net sales 11,241.8 11,565.1 Cost of sales (4,523.1) (3,960.3) Gross profit 6,718.7 7,604.8 Sales and marketing expenses (2,925.2) (3,063.0) Administrative expenses (555.7) (533.6) Other operating income/(expenses) 290.8 392.3 Normalized EBIT 3,528.6 4,400.5 Exceptional items (28.7) (6.2) Income from operations (EBIT) 3,499.9 4,394.2 Net finance results (872.6) (1,171.3) Share of results of associates 1.0 7.4 Profit before income tax 2,628.3 3,230.4 Income tax expense (338.5) (336.4) Profit 2,289.8 2,894.0 Attributable to: Equity holders of Ambev 2,199.1 2,766.9 Non-controlling interest 90.7 127.1 Basic earnings per share (common) 0.14 0.18 Diluted earnings per share (common) 0.14 0.18 Normalized Profit 2,316.0 2,900.2 Normalized basic earnings per share (common) 0.14 0.18 Normalized diluted earnings per share (common) 0.14 0.18 Nº of basic shares outstanding 15,689.8 15,688.9 Nº of diluted shares outstanding 15,821.4 15,809.4

slide-23
SLIDE 23

First Quarter 2017 Results May 4, 2017 Page 23 CONSOLIDATED STATEMENT OF CASH FLOWS

R$ million

1Q17 1Q16 Cash Flows from Operating Activities Profit 2,289.8 2,894.0 Depreciation, amortization and impairment 827.6 863.8 Impairment losses on receivables and inventories 28.2 24.2 Additions/(reversals) in provisions and employee benefits 49.1 90.8 Net finance cost 872.6 1,171.3 Loss/(gain) on sale of property, plant and equipment and intangible assets 5.4 (2.9) Equity-settled share-based payment expense 45.0 38.0 Income tax expense 338.5 336.4 Share of result of associates (1.0) (7.4) Other non-cash items included in the profit 123.5 (464.6) 4,578.6 4,943.6 Decrease/(increase) in trade and other receivables 1,438.3 1,021.6 Decrease/(increase) in inventories (199.9) (683.5) Increase/(decrease) in trade and other payables (2,707.9) (3,023.4) Cash generated from operations 3,109.0 2,258.2 Interest paid (155.2) (145.8) Interest received 55.3 44.6 Dividends received 3.9 19.8 Income tax paid (1,028.6) (4,391.7) Cash flow from operating activities 1,984.5 (2,214.8) Proceeds from sale of property, plant, equipment and intangible assets 10.5 15.6 Acquisition of property, plant, equipment and intangible assets (559.5) (707.3) Acquisition of subsidiaries, net of cash acquired (332.7) (1,695.1) Net proceeds/(investment) of debt securities 272.6 22.0 Net proceeds/(acquisition) of other assets 1.6 0.1 Cash flow used in investing activities (607.6) (2,364.8) Proceeds/(repurchase) of shares (48.4) 0.5 Proceeds from borrowings 1,238.2 773.1 Repayment of borrowings (1,482.8) (227.5) Cash net finance costs other than interests (429.9) (1,142.8) Payment of finance lease liabilities (2.3) (0.8) Dividends and interest on shareholders’ equity paid (1,132.0) (2,099.6) Cash flow used in financing activities (1,857.2) (2,697.2) (480.2) (7,276.8) 7,876.8 13,617.6 (167.5) (333.5) 7,229.1 6,007.3 Cash flow from operating activities before changes in working capital and use of provisions Cash and cash equivalents less bank overdrafts at end of period Net increase/(decrease) in Cash and cash equivalents Cash and cash equivalents less bank overdrafts at beginning of period Effect of exchange rate fluctuations