
SLIDE 1
Altitude(meter)
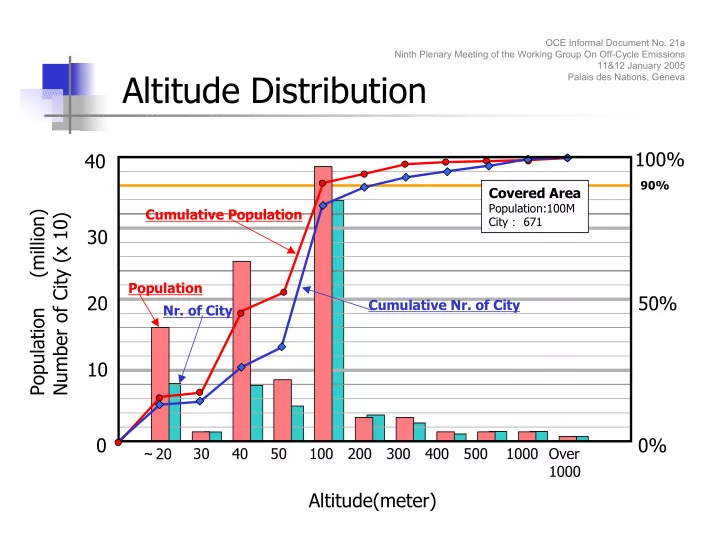
Altitude Distribution
Population (million) Number of City (x 10)
~20 30 40 50 100 200 300 400 500 1000 Over 1000
100% 0% 50% 10 20 30 40
Covered Area
Population:100M City: 671
Cumulative Population Cumulative Nr. of City Population
- Nr. of City
90%
OCE Informal Document No. 21a Ninth Plenary Meeting of the Working Group On Off-Cycle Emissions 11&12 January 2005 Palais des Nations, Geneva