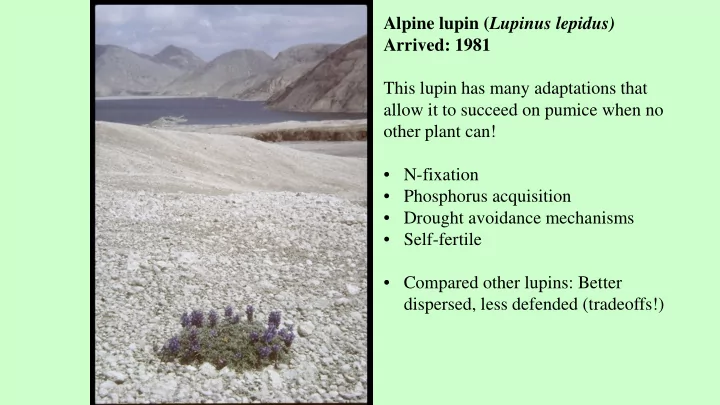
SLIDE 1 Alpine lupin (Lupinus lepidus) Arrived: 1981 This lupin has many adaptations that allow it to succeed on pumice when no
- ther plant can!
- N-fixation
- Phosphorus acquisition
- Drought avoidance mechanisms
- Self-fertile
- Compared other lupins: Better
dispersed, less defended (tradeoffs!)
SLIDE 2
2002
Lupins spread!
SLIDE 3
- Community N-limited
- Lupin is P-limited
Ecosystem N is limited by P Is system nutrient limited? Experiment: add nitrogen or phosphorus (repeated 2002-2006)
SLIDE 4
13 years later + 400 kg N/ha + 50 kg P/ha
7 years after stopping experiment – no visible effect. Undeveloped soils cannot retain nutrients!
SLIDE 5
Other plants could only grow in dead lupins!
SLIDE 6
Sedum oreganum
SLIDE 7
Spiranthes romanzoffiana
SLIDE 8
Western white pine
SLIDE 9
Lupins create soil that other species require to colonize
SLIDE 10
Data from Roger del Moral, University of Washington
Lupinus lepidus population dynamics
% Cover by Lupin
SLIDE 11
SLIDE 12
SLIDE 13
Specialist Root Boring Caterpillars
Hystricophora nr. roessleri (Tortricidae) Grapholita lana (Tortricidae)
Grapholita Hystricophora
SLIDE 14 Removal: 3.3x increase yr-1 Control: 0.36x decrease yr-1
LEAF MINER REMOVAL Density explosion
August 3, 2004
Fagan and Bishop 2000. American Naturalist 153: 238-251 Bishop 2002. Ecology. 83: 191-202 Bishop et al. 2005. in Ecological Responses to the 1980 Eruptions of Mount St. Helens Fagan et al. 2005. American Naturalist. 166: 669-685
SLIDE 15 Our data show:
- Each crash caused by insects
- Crashes slowed spread
across landscape
- Still occurring after 25 years!
(but in smaller areas)
SLIDE 16
Conclusion:
SLIDE 17
Conclusion:
SLIDE 18
Upland areas: Willows establish but don’t grow large
July 2010
Sitka Willow (Salix sitchensis)
SLIDE 19
SLIDE 20 Paranthrene robiniae (Sesiidae). Cryptorhyncus lapathi (Curculionidae)
SLIDE 21
After 10 years of borer exclusion (2017) Sprayed Not Sprayed
SLIDE 22
Control plot, 2014 71 willows in 2008, 4 in 2016
SLIDE 23
Control plot in foreground, Protected plot in background
Same plots in Google Earth
Willow borer exclusion (2018, year 11)
SLIDE 24 1080m elev. 1290m elev.
SLIDE 25
Year 11 Litter Layer in 400 cm2 @ 0.5m from base Typical control Typical sprayed plant
SLIDE 26
Seed predators Leaf tiers Root borers Plant competitors Parasitoids Ants, Spiders Beetles Insectivorous birds Small mammals Soil Resources Do early successional interaction webs promote extreme dynamics?
SLIDE 27
Seed predators Leaf tiers Root borers Plant competitors Soil Resources Do early successional interaction webs promote extreme dynamics?
SLIDE 28 Seed predators Leaf tiers Root borers Soil Resources Hypothesis: Low community complexity in early succession promotes extreme interactions If true
- Extreme herbivore effects involving multiple hosts
- Effects should diminish with system maturity
- Less effect in secondary succession
- Should occur in other primary successions
SLIDE 29 Leaf Miner Damage Surveys: ~160 sites/year for 17 years
- High chronic damage
- High heterogeneity
- Diminished by community
development
SLIDE 30 ~64% of all stem area is attacked Weevil Damage Survey: 154 plots on 9km transects
~620 plants/year
~90% stem mortality
~50% stem mortality
SLIDE 31
High density patch Low density patch
SLIDE 32 Larval mortality
Day 10 20 30 40 50 60 70 80 90 100 110 Number of larvae alive 5 10 15 20 25 30 35 40 45 50 5 10 15 20 25 30 35 40 45 50 Core Edge Tarone-Ware log-rank test: χ2 = 4.888, p = 0.027
SLIDE 33 Paradox of Enrichment:
High Density compete for P! Have less P/g leaf
SLIDE 34
Summary of 151 un- redisturbed sites 1980 2007 2010 2013 2016 2018 Exclu sions Cover 0% 40% 45% 48% 67% >100% # of Species 78 107 137 155 Moss % 0% 13% 26% 27% 26% 40% Lupin % 0% 24% 11% 4% 18% 20% Willow % 0% 6% 4% 4% 5% 50%
SLIDE 35 Noble Fir Western Hemlock
Conifer colonization at 170 transect points
- Three factors controlling conifers
(Titus & Bishop 2014, Birchfield & Bishop unpub., Wenke & Bishop unpublished) Seed limitation: adding Doug fir seeds led to high density of doug fir. Competition: Doug fir couldn’t establish in thick lupins or under shrubs Environmental conditions: 1) Fir trees more likely on steep north facing slopes (higher moisture availability) 2) Hemlock seeds have always blown in, but
- nly started establishing in year 30! Typically
in locations where soil is developing. What Controls Establishment of a New Conifer Forest?
SLIDE 36
Monument Act (1983): allow “the natural recovery of the volcanic landscape, to the benefit of public and scientific understanding” “protect the geologic, ecologic, and cultural resources.”