
SLIDE 1
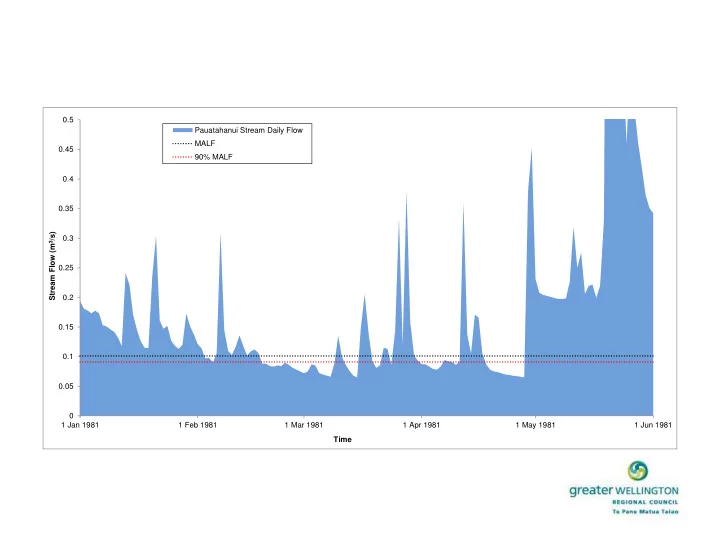
0.05 0.1 0.15 0.2 0.25 0.3 0.35 0.4 0.45 0.5 1 Jan 1981 1 Feb 1981 1 Mar 1981 1 Apr 1981 1 May 1981 1 Jun 1981 Stream Flow (m3/s) Time Pauatahanui Stream Daily Flow MALF 90% MALF
0.5 Pauatahanui Stream Daily Flow MALF 0.45 90% MALF 0.4 0.35 - - PowerPoint PPT Presentation
0.5 Pauatahanui Stream Daily Flow MALF 0.45 90% MALF 0.4 0.35 Stream Flow (m 3 /s) 0.3 0.25 0.2 0.15 0.1 0.05 0 1 Jan 1981 1 Feb 1981 1 Mar 1981 1 Apr 1981 1 May 1981 1 Jun 1981 Time Water allocation Te Awarua-o-Porirua whaitua
0.05 0.1 0.15 0.2 0.25 0.3 0.35 0.4 0.45 0.5 1 Jan 1981 1 Feb 1981 1 Mar 1981 1 Apr 1981 1 May 1981 1 Jun 1981 Stream Flow (m3/s) Time Pauatahanui Stream Daily Flow MALF 90% MALF
safe to catch and eat
provides for economic
stream
contaminants in the stream
and fish passage
when they need it
water and discharges within the limit?
0.05 0.1 0.15 0.2 0.25 0.3 0.35 0.4 0.45 0.5 1 Jan 1981 1 Feb 1981 1 Mar 1981 1 Apr 1981 1 May 1981 1 Jun 1981 Stream Flow (m3/s) Time Pauatahanui Stream Daily Flow Minimum Flow = 90% MALF Residual Stream Flow After 30% MALF Allocation 0.05 0.1 0.15 0.2 0.25 0.3 0.35 0.4 0.45 0.5 1 Jan 2014 1 Feb 2014 1 Mar 2014 1 Apr 2014 1 May 2014 1 Jun 2014 Stream Flow (m3/s) Time Pauatahanui Stream Daily Flow Minimum Flow = 90% MALF Residual Stream Flow After 30% MALF Allocation
Value Attribute Effect Alternative minimum flow and allocation amounts compared to 90+30 100+20 90+20 100+25 90+25 100+30 90+30 100+40 90+40 Ecosystem health and mahinga kai Habitat protection Intensity
‘human induced’ stress Better Same Better Same Better Good protection Better Same Additional days of stress at
Better Better Better Slightly better Same Worse Worse Economic use
Supply reliability Time with full access to allocation amount Same Better Slightly worse Slightly better Worse Moderate reliability Worse Worse Time on total restrictions Worse Same Worse Same Worse Worse Same Availability of water for economic use Amount of water that can be taken from a stream Less More
precautionary with better habitat protection, less water available and similar
CONSENTED WATER TAKES
OTHER PERMITTED ACTIVITY WATER USE STOCK DRINKING WATER & DOMESTIC USE
ALLOCATION LIMIT
MALF Alternative limits Consented Stock & domestic Existing allocation 20 25 30 40 TG Other With TG Without TG Pauatahanui Stream 96 19 24 29 38 14 13 4 31 17 Horokiri Stream 89 18 22 27 36 21 2 2 25 4 Porirua Stream 151 30 38 45 60 2 2 2 Duck Creek 15 3 4 5 6 4 1 5 1