
SLIDE 1
Alcohol-related traffic accidents with fatal outcomes in the city of - - PDF document
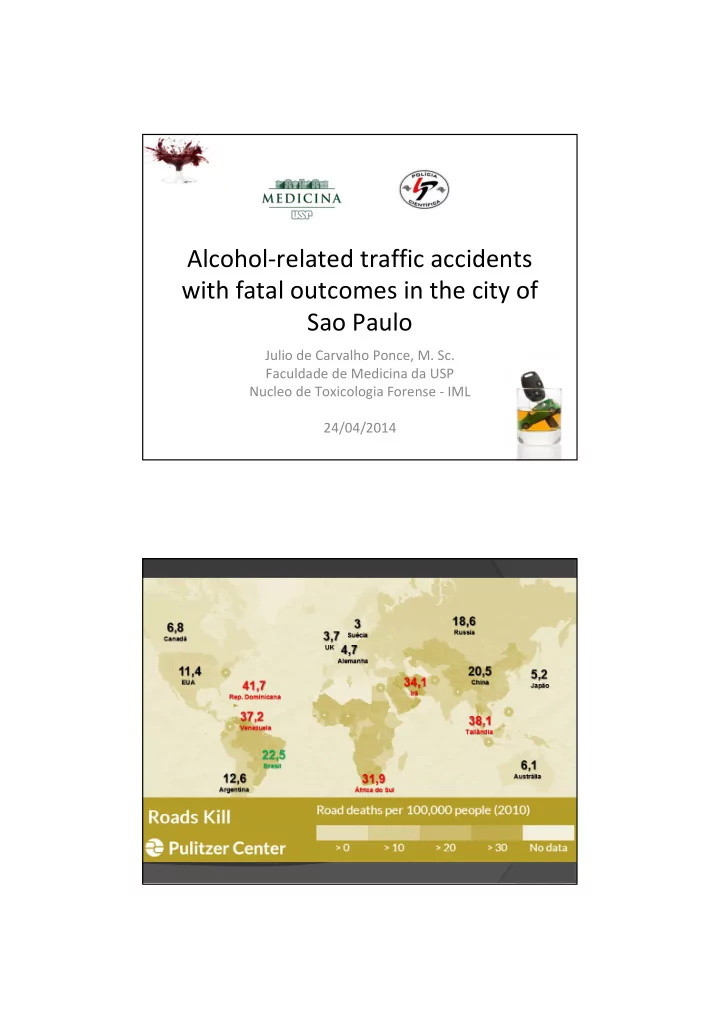
Alcohol-related traffic accidents with fatal outcomes in the city of Sao Paulo Julio de Carvalho Ponce, M. Sc. Faculdade de Medicina da USP Nucleo de Toxicologia Forense - IML 24/04/2014 Alcohol use and negative consequences Around 75%
Carlini, et al. II Levantamento Domiciliar sobre
DATASUS, 2014; Pechansky, et al. Rev Bras Psiq 2009
Datasus, 2014; Denatran, 2014
Datasus e Renaest, 2008 IPEA, ANTP, 2003
Datasus e Renaest
Heng et al, 2006 Zador, 2000
The risk of being involved in an accident with a fatal victims approximately double for each increase in 0.2 g/L in the drivers BAC.
Medico-Legal Institute (IML/SP) Autopsy Report (Forensic Coroner) Forensic Toxicology Laboratory (NTF-IML/SP) Blood Alcohol determination (Criminal Analysts)
* Statistically significant difference; p<0,01
Position in the vehicle total Females n (%) Males n (%) Mean age Driver 113 12 (10,62) 101 (89,38) 34,1 Cyclist 48 2 (4,17) 46 (95,83) 32,9 Motorcycle Passenger 29 15 (51,72) 14 (48,28) 24,8 Motorcyclist 196 1 (0,51) 195 (99,49) 28,1 Occupant 21 5 (23,81) 16 (76,19) 25,5 Motorcycle
6 6 (100) 21,3 Pedestrian 405 125 (30,86) 280 (69,14) 48,1 Passenger 80 23 (28,75) 57 (71,25) 27,8 NC 9 2 (22,22) 7 (77,78) 30,9 Total 907 185 (20,40) 722 (79,6) 37,8 Fatal victims by victim type, gender and mean age
Position of the victim Total n (%) Positives n (%) Negatives n (%) Driver 113 (12,5) 63 (55,8) 50 (44,2) Passenger 80 (8,8) 33 (41,3) 47 (58,8) Cyclist 48 (5,3) 18 (37,5) 30 (62,5) Motorcyclist 196 (21,6) 78 (39,8) 118 (60,2) Motorcycle passenger 29 (3,2) 8 (27,6) 21 (72,4) Pedestrian 405 (44,7) 142 (35,1) 263 (64,9) Occupant 21 (2,3) 10 (47,6) 11 (52,4) Motorcycle occupant 6 (0,7) 2 (33,3) 4 (66,7) NC 9 (1,0) 3 (33,3) 6 (66,7) Total 907 357 550
Fatal Victims by position and Positive BAC
Julio de Carvalho Ponce, Daniel Romero Muñoz, Gabriel Andreuccetti, Débora Gonçalves de Carvalho, Vilma Leyton, Alcohol-related traffic accidents with fatal outcomes in the city of Sao Paulo, Accident Analysis & Prevention, Volume 43, Issue 3, May 2011, Pages 782-787
Adherence to the law at the time
BAC (g/l) Position of the victim ≥0,6* n (%) <0,6* n (%) Total Drivers 63 (55,75%) 50 (44,25%) 113 Cyclists 17 (35,42%) 31 (64,58%) 48 Motorcyclists 71 (36,22%) 125 (63,78%) 196 Total 151 206 357
* Statistically significant difference; p<0,01 p<0,01 Mean BAC by victim position
Victim position N Mean BAC(g/l) Drivers 113 1,6 ± 0,65 Cyclists 48 1,8 ± 0,78 Motorcycle Passengers 29 1,6 ± 0,97 Motorcyclists 196 1,5 ± 0,68 Occupant 21 1,3 ± 0,77 Motorcyle occupant 6 1,1 ± 0,49 Pedestrians 405 2,0 ± 0,96 Passengers 80 1,5 ± 0,71 NC 9 1,6 ± 0,2 Total 907 1,7 ± 0,84
5 simultaneous approaches:
mobilize the local population;
participation from local bars;
enforcement of underage drinking laws;
enforcement;
regarding place, number and concentration. Traffic accident reduction at night: 10 % Alcohol-related traffic accident reduction: 6% Aggression reduction: 43% Aggression with hospital care reduction: 2% Self-reported drunk driving reduction: 49% All results despite an increase in alcohol consumption
Holder, H.D.; Gruenewald, P.J.; Ponicki, W.R.; et al. Effect of community-based interventions on high- risk drinking and alcohol-related injuries.JAMA: Journal of the American Medical Association 284:2341– 2347, 2000