Alaskan Salmon A review of ecosystems and how salmon tie it all - - PowerPoint PPT Presentation
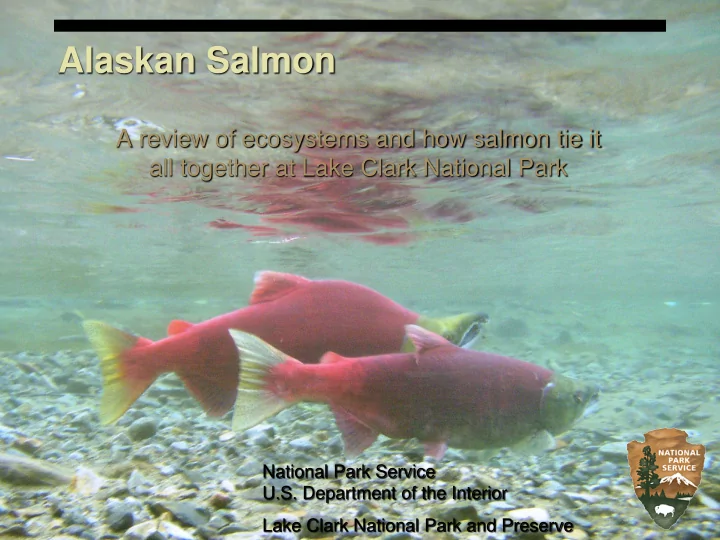
Alaskan Salmon A review of ecosystems and how salmon tie it all together at Lake Clark National Park National Park Service U.S. Department of the Interior Lake Clark National Park and Preserve Before we start Lake Clark National Park is
Before we start…
Lake Clark National Park is located in Southwestern Alaska
It is the largest lake contained within a National Park in the United States
There are 37 different terrestrial mammals, 5 marine mammals, 126 birds, and 1 amphibian species that call this park home
It also has one of the largest spawning grounds of sockeye salmon in the world
It is one of 25 National Parks and Preserves in Alaska and one of 401 Parks, Preserves, and Monuments Nationwide that you can explore!
Key Terms
Lets see if you can define these terms dealing with
salmon populations and your Biology Class.
Ecosystem Ecological Resilience Escapement (term specifically from fisheries)
Term Check
Ecosystem
A level of ecological study that includes all the
- rganisms in a given area as well as the abiotic factors
with which the interact; a community and its physical environment
Ecological Resilience
Measure of the persistence of systems and of their
ability to absorb change and disturbance and still maintain the same relationships between populations or state variables
www.phschool.com/science/biology_place/glossary/ www.ecologyand society.org/vol12/iss1/art23/table1.html
Term Check
Escapement
The number of fish allowed to escape the fishery and
spawn in their natural spawning grounds
Meaning the fish that aren’t caught by sport fishermen,
native subsistence fishers, other animals, or scientists
www.adfg.alaska.gov
Facts about Lake Clark Salmon
Lake Clark and the Newhalen River are spawning
grounds for sockeye salmon coming in off Bristol Bay
Bristol Bay is one of the last wholly wild salmon runs
in the United States
The salmon are running between June and August Even though the salmon are running in the summer
some won’t spawn until November in glacial rivers because there’s too much sediment in the water
The ecosystem of Lake Clark
Lake Clark National
Park is a subarctic terrain
At the top of the food
chain are: Humans, Bears, Wolves, Lynx, and Bald Eagles
Lots of small mammals,
voles, martins, etc.
There are 6 main fish
species in the lake, only the salmon lives fresh to salt to fresh water
The plants range from
low bush berries, to liverworts and lichens, to shrubs (dwarf birch, alder, willow), ferns, and fireweed, through black and white spruce and birch trees with pockets
- f aspen and
cottonwood trees
There are a variety of
beetles, mosquitos, white socks, and flies
A variety of mushrooms
act as decomposers
Salmon’s role
Salmon, a biotic factor, are the biggest form of fertilizer in
the park. They offer nutrients for everything from trees to animals
They are consumed by many large animals including:
Wolves Bears Eagles
Their bodies will wash up on shore after they have
spawned and become part of the soil, providing nutrients to the trees, shrubs, and providing a host location for fungi
Those bodies of the salmon that don’t wash up on shore
will deteriorate in the water providing nutrients to sustain a productive lake/river and provide food for other fish species
Ecological Resilience
“Salmon have an amazing natural resilience to human
and natural disturbance. Salmon in Alaska are doing well compared to the lower 48 because Alaska has a largely intact natural system. Bristol Bay sockeye returns are a good example of that stability and
- resilience. The region has large and stable returns
despite high levels of commercial exploitation. Individual watersheds and rivers in the area have a large amount of variability in the amount of salmon
- ver time. That natural variation (and sometimes
decline) is often viewed by the public with concern, but is a normal part of a healthy system.” –Andrew Kirby Fish Technician
Newhalen River Escapement Project
Dan Young is the biologist
spearheading the escapement project at Lake Clark
His goal is to create an
index tabulating the amount of fish that are passing through the different watersheds to see:
How many are going
through
Where the fish are going What population is
male/female
How old the fish are How long they spent in
fresh water vs. saltwater
Newhalen River Escapement Project
The project has been going on since 1980.
There was a break from 1984 until Dan and his crew picked
the project up again in 2000.
The index is very important because it gives us, not only
the daily counts so that we can see how many salmon are passing, but also if we are anywhere near the numbers from previous years
This can help us see:
Environmental impacts (volcanoes erupting, climate
changes, etc.)
Human impacts (over fishing – sport fishing, waste or
pollution, etc.)
Changes in other animal populations – effects of the number
- f salmon on bear and wolf populations
Salmon’s resilience despite commercial fishing in the area
Newhalen River Escapement Project
The Newhalen river is
- ne of the sites
monitoring salmon as they pass from Bristol Bay.
There are counting
towers on either side of the river
Fish crew will stand in the
counting towers 10 minutes every hour and count salmon as they pass by
They take the data and
extrapolate to account for the amount of fish that would have passed in an hour
Fish crew can see the salmon easier by the white mesh on the river bed. There are clickers to count when the runs come in. Sometimes they are counting over 1,000 fish in a 10 minute period.
Newhalen River Escapement Project
The project has seen some pretty stable numbers
- ver the years
Usually ranging from 7%-15% off normal
We have seen a common trend in the data gathered
at the Newhalen
The run tends to lasts from the end of June until the
middle of August.
Some runs start earlier in June and end earlier, some will
start later and run well into September
Newhalen River Escapement Project
If you look at the
graph you can see the trends of the Newhalen river, there is an
initial spike, a plateau, a final spike
before the graph
evens out and the run is over.
Newhalen River Escapement Project
Fixing nets, measuring fish, counting in towers, and collaborating with local people are all tasks that occur at River Mile 22
Telaquana Weir
Telaquana river is
much smaller, less distance across
Instead of counting
towers, they have a weir
The weir is a long
fence the goes across the river.
It prevents any fish
from going up or down stream except where there is an
- pening.
The weir has been in
existence only a few years, so there isn’t as much data
We are noticing, as
the project continues, some of the same trends
Telaquana Weir
0.0 10.0 20.0 30.0 40.0 50.0 60.0 70.0 80.0 6/25 6/30 7/5 7/10 7/15 7/20 7/25 7/30 8/4 8/9 8/14 8/19 8/24 8/29 9/3 Number of Fish (Thousands) Telaquana River Cumulative Sockeye Escapement
2010 2011 2012 2013 2014
Telaquana Weir
The weir is monitored by one of two ways
They have people who sit on the weir and count
fish for one hour every 4 hours (that’s 6 hours a day) at all other times the weir is closed off and fish wait to pass
There is a camera mounted in the weir that
captures footage every hour. The footage is then analyzed by Fish Crew every day for salmon counts, gender, etc.
Telaquana Weir
Fish Crew member James monitoring salmon at the weir