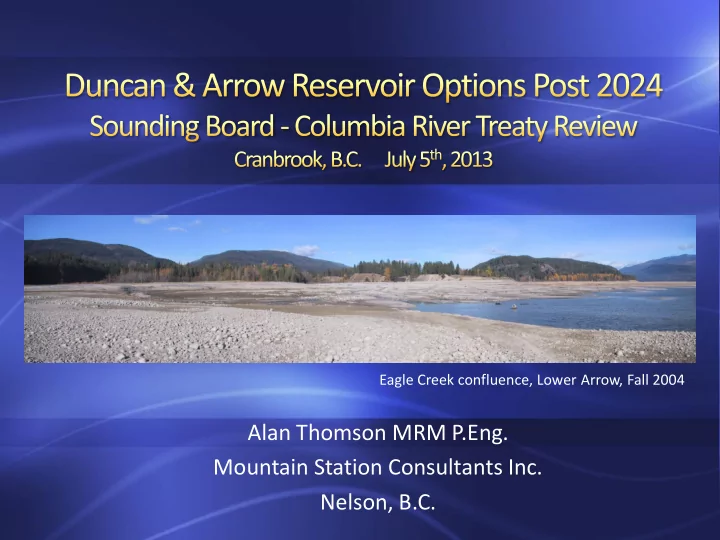
SLIDE 1 Alan Thomson MRM P.Eng. Mountain Station Consultants Inc. Nelson, B.C.
Eagle Creek confluence, Lower Arrow, Fall 2004
SLIDE 2
- 1. Duncan Reservoir options – High Level View
Status Quo – no change to facility or operation Decommission dam Install power generation infrastructure
- 2. Dam decommissioning description and cost
Duncan and Hugh Keenleyside dams, ALGS
- 3. Arrow Reservoir - Stable pool benefits and
issues.
- 4. Conclusions / Questions / Discussion
SLIDE 3 Photo Credit: Grant Trower
SLIDE 4
- Primary Purposes: increase generation revenue of
downstream hydro projects; flood control benefits in Kootenay Lake, Trail, Castlegar and US (Portland).
- Reservoir – 45 km long; 71.5 km2 at full pool; fluctuates
30-31.4 m.; live storage 1.4M acre-ft or 1.73 km3
- Dam – earth filled; no installed generation; 792 m long;
38.7 m high; low level outlets; spillway.
- BC Hydro owned and operated; operation dictated
largely by Columbia R. Treaty.
SLIDE 5 Source: BC H presentation to RDCK Mar 22 2013.
SLIDE 6
– Stranding in side channels – ramping rate protocols – Spawning in side channels and mainstem – flow quantity and duration. – Bull trout passage; mitigated through low level outlets
– Increase in quantity; reduction in quality of life for area residents
- Total Gas Pressure, Water Temperature
– TGP increases in lower Duncan River with spilled water >90 m3/s. – Water temperature strongly correlated with releases from spill way and low level outlets ; provincial WQ guidelines exceeded at times.
SLIDE 7
– Lower Duncan properties can flood during August releases (up to 400 m
3/sec.)
– Erosion Protection in Argenta Slough.
– Reduced cottonwood recruitment along river banks
SLIDE 8
Terrestrial Wildlife
– Loss of riparian vegetation important for wildlife due to unnatural inundation
Fish stocks
– All species (Burbot, rainbow, bull and cutthroat trout, whitefish, kokanee, white sturgeon, plus non-sport fish) impacted to an unknown degree. – Entrainment – Loss of littoral zone – Burbot spawning in tribs.
Recreation
– Drawdown makes navigation, access (east shore) difficult.
Cultural Resources (?)
– Bank erosion due to fluctuating reservoir levels potentially affects 2 sites.
SLIDE 9
- Power Generation vs.
- Flows for fish in the lower Duncan R.; fish habitat in reservoir
- Flood management
- Mosquito breeding in Duncan R. lowlands
- Wildlife in lower Duncan – Cottonwood recruitment
- Wildlife habitat in reservoir
- Costs estimated $2.6M/yr from lost generation revenue due to operational
constraints
- Recreation Quality vs. Reservoir Riparian Productivity.
– Keep reservoir high in summer months
– Side channel fencing, physical works throughout (4 as of 2013 costing $2.2 M as reported in WUP Annual Report),
- Ongoing Monitoring and Assessments (17 as of 2013; cost ~$9M in
2013 WUP Annual Report).
SLIDE 10
- Drain reservoir
- Notch dam
- Remove
spillway and seal low outlet tunnel
stabilize new channel
- Rehabilitate Duncan R. and watershed to pre-dam
condition (over time).
SLIDE 11
Pre Dam Construction Post Dam Construction
SLIDE 12
Glines Canyon Dam Elwha River, WA. Removal 2012.
210 feet high. Reservoir: 250 hectares $351 M final cost for removal of 2 dams
Source: National Parks Service
SLIDE 13
- 19 m high, 685 m long
- Storage of 11,000 acre ft
- Dam safety issue
Source: Seyers. 2004.
SLIDE 14
- Coursier (2003): $4.6M for 0.1M m3
- f material moved, 1.27 km2 upland
restored.
- Duncan (2013): 1.1M m3 of material
moved; 21.5 km2 of floodplain, upland restored (17x).
- Estimate $70-$100M; requires a full
accounting cost/benefit analysis that would include:
– lost revenue from downstream generation (Kootenay R. plants and US Columbia R. plants) – impact on ALGS and Arrow Reservoir (generation, flood control, etc.) – Ecosystem benefits, compensation/monitoring costs, etc.
For reference:
- Glines Canyon dams (WA): $351M US
for 2 concrete dams.
- Klamath R. watershed (OR, CA): 4
concrete dams for $460M US
Coursier Dam, S. of Revelstoke
SLIDE 15
- CPC: Initial pre-feasibility exploration of generation
potential.
- 20-30 MW generation capacity; 80-120 GWh/yr.
- Install units in existing low level outlet area.
- $100-$130/MWh cost range.
- Operate January – June.
- Transmission to Kaslo with line upgrade.
- Waneta is CPC’s current focus.
SLIDE 16
- Status Quo (#1) and Installing Power Generation (#3) are
very similar in terms of continuing impact.
– Generation: Provide alternative BT passage; CPC revenue; fund local initiatives, employment, etc.
– Reservoir riparian vegetation will re-establish; benefits wildlife, shore erosion. – all dam/reservoir related fish issues will be resolved (stranding, access to spawning/rearing habitat past dam, entrainment, etc.) – Mosquitos - ? – poor conditions pre-dam in LDR. – TGP/temperature – non-issues. – Kootenay Lake fertilization – reduce or eliminate. – Reduced generation revenue and flood management control in Kootenay Lake.
SLIDE 17
- Length: 240 km
- Area at full pool: 464 km2
- Live storage of 7.1 M acre-feet or 8.8 km3
- Drawdown 40-50 ft; up to 66 ft if required
- Area between high and low pool: 19 km2
SLIDE 18
Source: Water Survey of Canada
1930-1968 – before HLK dam commissioned. Red line: 1950 1969-2011 – after HLK dam commissioned. Red line: 1980
SLIDE 19
- Considerable and persistent
- impacts. Well documented,
studied, understanding somewhat clear, on going monitoring/adjusting; quantitative and qualitative impact assessments.
– Link most Arrow impacts (environmental and others) back to fluctuating water levels, and unnatural drawdown and flood duration/timing. – Propose reservoir operation to mimic natural lake hydrograph - constant elevation with short duration spike during freshet.
SLIDE 20
impact recreation, tourism and forestry
– Shore and boat recreation/tourism; beaches disappear. – CP: shore access greatly improved; beaches in late summer.
SLIDE 21
– Access to spawning tributaries compromised at low level; channel degradation due to fluctuating res. levels – CP: Fish access greatly improved; increased stable spawning habitat exposed in fall for KO. – Productivity may be limited by low spring reservoir levels. – CP: Development of littoral zone will increase biological productivity. – Compensation programs somewhat ineffective (creel surveys indicate decreasing BT and KO populations). – CP: scale back many compensation programs.
SLIDE 22
– Rising spring levels displace nesting waterfowl and shorebirds; fall levels impact migratory bird habitat availability; reduced fish populations impact raptors; riparian areas lost; acute problems in Mid- Columbia reach downstream of Revelstoke. – CP: Water still rises in spring but to lesser degree and shorter duration.
– Shoreline erosion caused by fluctuating levels; biologically productive littoral zone non-existent. – CP: shoreline riparian vegetation will resist erosion; littoral zone will return.
– Accidents due to changing water levels and boating hazards exposed at lower levels. – CP: both addressed.
SLIDE 23
– Road sinking and sluffing following very high reservoir levels. – CP: addressed
– Erosion at several cultural sites due to fluctuating reservoir levels – CP: erosion will subside but
- verall effect unknown due to
lack of public info.
- Social and community health
and well being.
– CP: would address some of the residual social impacts and the hurt, anger and mistrust felt by Arrow Valley residents.
Farm in drawdown zone before and after HLK dam
SLIDE 24
- Dust generation during drawdown
– CP: greatly reduced dust generation.
– Compensation programs reduced.
– Agricultural loss, access to forestry operations, Log booming limited at low levels; marinas impacted at high levels; many others. – CP: limited agriculture could take place in some locations; productivity would increase over time. Log booming and marinas both benefit.
SLIDE 25
- Cost $270M; 1,000 person-years of
employment.
- Up to 185MW capacity;
- Jointly owned by CPC/CBT, managed
by BC Hydro, operated by Fortis.
- Generates power when reservoir
between ele. 1395 to 1446 ft.; greater
- utput at higher reservoir elevations.
- Net annual income ~ $14M-$16M
excluding Waneta financing costs
SLIDE 26
Not modeled by BPA, BC Hydro (high constant pool was). Pro
– Arrow Lk Gen Station: at elevation 1425 ft. output average 2002- present: 2,800 MWhrs per day; 63% capacity. – Current average over all years: 2,200 MWhrs per day. – Revenue?; power value varies seasonally. – All socio-economic attributes associated with stable pool. – Mid Columbia; greater terrestrial, bird habitat exposed; more riverine habitat. – Kokanee access constant, greater low gradient spawning habitat, more valley bottom terrestrial habitat.
Con
– Loss of some Mid –Columbia ecological values. – Terrestrial and aquatic rehabilitation costs; socio-economic adjustment costs; others
Tradeoff
– Generation at ALGS vs. ecological values in Mid Columbia reach.
SLIDE 27
- Unprecedented in scope.
- ALGS removed ($270M+ facility), intake channel filled; HLK
earthen and concrete dam removed, locks deactivated, dam area completely restored.
- Reservoir infrastructure costs (roads relocated, ferry
infrastructure, recreational facilities, municipal infrastructure, …etc.)
- Rehabilitation/restoration costs for 108.4 km2 of pre-dam
wetlands, floodplain and uplands areas.
SLIDE 28 Existing PM
All associated with weekly or seasonal reservoir elevation changes i.e. – inside the reservoir footprint. All associated with the WUP as developed inside the constraints of the CRT.
- Mid Columbia and Arrow Reservoir PMs
– Navigation, Recreation, Heritage and Culture, Dust, Wildlife, Fish, Vegetation, Erosion.
Additional PM or…
Suggest examine issues using full cost accounting principles that are external to reservoir footprint to examine operating alternatives. Not necessarily Performance Measures.
- e.g.- Agricultural production, economic and regional development,
tourism potential, social health, etc.
SLIDE 29
– Report out Duncan operation and costs/benefits with/without Treaty; – Consider impacts on revenue, flood control, environmental benefits/costs.
– Model mid pool constant elevations in 1415-1430 ft range; impact on Mica to lower Columbia. – Update Performance Measures used to evaluate various Arrow constant pool scenarios. – Evaluate ALGS under various constant pool scenarios.
SLIDE 30
- Impact of Duncan operations very similar under Status Quo
and Generation options
- Dam Decommissioning would resolve most if not all
environmental issues but comes at a lost revenue cost; unprecedented in scale but not impossible
- Difficult to fully assess Duncan options when relatively little is
known about reservoir biological values; ongoing monitoring studies remain inconclusive.
- Other options for Duncan operation may exist other than
those presented.
SLIDE 31
- Arrow low-mid constant pool elevation scenario
mitigates many current socio-economic and environmental impacts;
- Reservoir modeling and public consultation required
to determine optimal elevation.
- Reservoir rehabilitation under low-mid constant pool
scenarios is unprecedented but possible given adequate resources.
SLIDE 32
- ALGS generation is likely profitable under a variety of
constant mid pool scenarios.
- Decommissioning HLK dam expensive and not
required to achieve multiple benefits associated with low-mid constant pool option.
SLIDE 33
Alan Thomson MRM P.Eng. Mountain Station Consultants Inc., Nelson B.C. Kokanee Spawning Channel