SLIDE 1 Agenda
October 24, 2015 Council of Councils
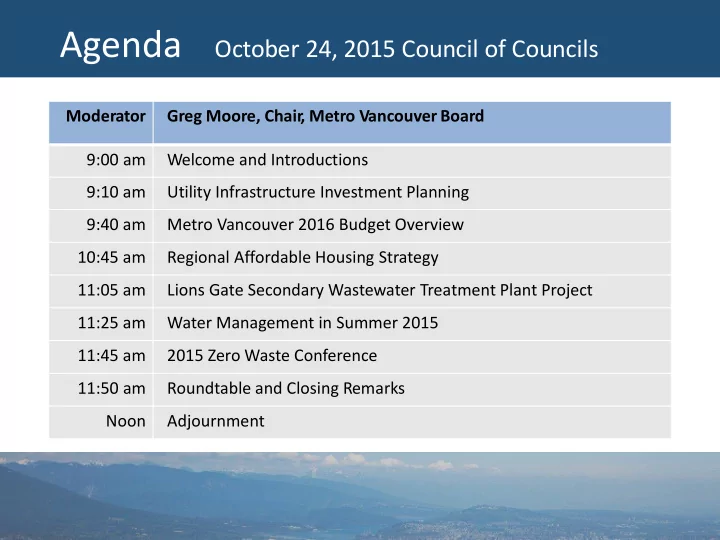
Moderator Greg Moore, Chair , Metro Vancouver Board 9:00 am Welcome and Introductions 9:10 am Utility Infrastructure Investment Planning 9:40 am Metro Vancouver 2016 Budget Overview 10:45 am Regional Affordable Housing Strategy 11:05 am Lions Gate Secondary Wastewater Treatment Plant Project 11:25 am Water Management in Summer 2015 11:45 am 2015 Zero Waste Conference 11:50 am Roundtable and Closing Remarks Noon Adjournment
SLIDE 2 Metro Vancouver Council of Councils
Surrey City Hall
Moderator: Greg Moore
Chair, Metro Vancouver Board
October 24, 2015
SLIDE 3
Year In Review
Year in Review Video http://bcove.me/d4fwcykp
SLIDE 4
Utility Infrastructure Investment Planning
Council of Councils
Frank Huber, Rick Gallilee, Dean Rear October 24, 2015
SLIDE 5 Water Assets Quantity Dams 5 Water Treatment Plants 2 Transmission Mains >500 km Pump Stations 19 Storage Reservoirs 25 Rechlorination Stations 8
- 2.4M population served
- Avg demand = 1 billion litres/day
Assets Metro Vancouver Owns and Operates
Water
5 23% 16% 36% 9% 16% 0.3% Dams Water Treatment Plants Transmission Mains Pump Stations Storage Reservoirs Rechlorination Stations
SLIDE 7
- 2.4M population served
- Avg flow = 1.2 billion litres/day
Assets Metro Vancouver Owns and Operates…
Liquid Waste
7
Wastewater Assets Quantity Wastewater Treatment Plants 5 Trunk Sewers >500 km Pump Stations 33 Storage Facilities 2
64% 31% 5% 0.2% Wastewater Treatment Plants Trunk Sewers Pump Stations Storage Facilities
SLIDE 9 9
Utility In Infrastructure In Investment Planning Process
SLIDE 10 Planning Framework
- Board Strategic Plan
- MV 2040 Regional Growth Strategy
- Integrated Liquid Waste and Resource Management Plan
- Drinking Water Management Plan
10
SLIDE 11 Growth Upgrade Risk (Resilience) Maintenance Opportunity
11
Infrastructure Investment Drivers
SLIDE 12
Growth
SLIDE 13 Growth
- Growth translates into significant infrastructure needs
- Manage growth through regional and municipal plans
- Educate public to reduce per capita demand
- Use regulations and conservation measures
13
SLIDE 14 Upgrade
14
Seymour-Capilano Filtration Plant Lions Gate WWTP
SLIDE 15 Upgrade
- Regulated service expectations driven by guidelines and legislation
- Water projects include SCFP and Coquitlam Water Treatment
Plant
- Liquid Waste projects include Lions Gate and Iona WWTP
- Non-regulated service expectations
- Includes increased resource recovery, greenhouse gas
reductions, odour control and system automation
15
SLIDE 16 Risk (Resilience)
16
SLIDE 17 Risk (Resilience)
- Resiliency to climate change & natural hazards
- Includes flooding & earthquakes
- 25% of capital expenditures over next decade
- GVWD lifeline study completed in mid-1990’s
- Seismic Upgrade program continues
- New infrastructure built to latest codes
- Key marine crossings to be hardened
- Liquid Waste has begun a similar program
17
SLIDE 19 Maintenance
- Deterioration of infrastructure over time
- Coordinated with annual maintenance actions
- Major projects that exceed operating budgets
- Long range forecasts reflect replacement costs
- Major infrastructure continuously refurbished
- Other programs include maintenance benefits
19
SLIDE 21 Opportunity
- Recover energy from water and wastewater
- Nutrient recovery from wastewater
- Utilization of digester gas
- Riparian habitat improvements
- Non-regulated projects that yield benefits
21
SLIDE 22 Infrastructure Investment Decision Process
22
SLIDE 23 Infrastructure Investment Decision Process
- Infrastructure issues, risks, and opportunities are
identified
- Organized by the infrastructure investment drivers
- Growth
- Upgrade
- Risk (Resilience)
- Maintenance
- Opportunity
23
SLIDE 24 Infrastructure Investment Decision Process
- Options to address needs are prepared and analysed.
- Investment alternatives identified
- O&M Strategy changes
- Emergency Preparedness and Response Plans
- Liaison with municipal partners
24
SLIDE 25 Infrastructure Investment Decision Process
- Proposed infrastructure investments are consolidated
into a portfolio that is run through multiple scenarios to balance cost, risks and benefits to services
- Prioritization criteria include:
- Comply with existing regulations
- Meet non-regulated service levels
- Comply with new/modified regulations
- Meet growth projections
- Improve resiliency to major adverse events
- Cost savings
- Improve environmental stewardship
25
SLIDE 26 Infrastructure Investment Decision Process
- Infrastructure investment requests are approved for
funding
- Projects are implemented and new/modified
infrastructure is integrated into the utilities
26
SLIDE 27
Annual Capital Planning Cycle
SLIDE 28 Projected Capital Spending for Next 10 Years
28
$3.1B $4.1B
SLIDE 29 Large Liquid Waste Projects
29
Opportunity Growth Risk Management Maintenance Upgrade
2020 2030 2010
$0B $1B $2B $3B
Northwest Langley WWTP North Surrey Interceptor Iona Secondary WWTP
$4B
Non-Large Projects (~150)
Sapperton Pump Station
Lulu Digester No. 3 AIWWTP Ammonia Removal South Surrey Interceptor Gilbert Trunk Sewer
Annacis Island WWTP Stage 5 Lions Gate Secondary WWTP
South Surrey Interceptor Dredging Impacts
SLIDE 30 Lulu Island Delta Main - Dredging Impacts Tilbury Main - Dredging Impacts Capilano Hydropower Kennedy Newton Main
Coquitlam Intake No. 2
Construction
Annacis Main No. 5 (Marine Crossing) Second Narrows Crossing (Tunnel)
Seymour Main No. 5 III (North) South Surrey Main No. 2 Coquitlam Main No. 4
Opportunity Growth Risk Management Maintenance Upgrade)
Design
Large Water Projects
30
Non-Large Projects (~90)
$0B $1B $2B $3B
2020 2030 2010
$4B
Coquitlam Intake No. 2 Cambie Richmond Main (Marine Crossing)
SLIDE 31 Infrastructure Investment Funding
- Funding Philosophy
- Pay as You Go
- Conservative Use of Borrowing
- Source of Funding
- Water Rate
- Liquid Waste Levy
- Development Cost Charges
- Long Term Thinking
- Strengthen policy to ensure fiscal sustainability
31
SLIDE 32 Infrastructure Investment Funding
32
Operating Capital
Water Services
2016 Proposed Budget
($ Millions)
Revenues: Water Sales 251.8 $ Other Revenues 0.9 Reserve Funding 0.7 Total Revenues 253.4 $ Expenditures: Operating Costs 81.7 $ Allocated Centralized Support Costs 18.4 Debt Service Costs (Principal & Interest) 98.2 Contribution to Capital Program 55.1 Total Expenditures 253.4 $ Average Household Impact 158 $
Capital Expenditures: Infrastructure Growth 39.4 $ Infrastructure Maintenance 26.0 Infrastructure Risk Management 92.6 Infrastructure Upgrade 18.3 Opportunity Projects 3.2 179.5 $ Capital Funding: Reserves - Surplus 18.8 $ Long Term Borrowing 105.6 Contribution to Capital 55.1 179.5 $
SLIDE 33 Infrastructure Investment Funding
33
Liquid Waste Services
2016 Proposed Budget
($ Millions)
Operating Capital
Revenues: GVSDD Levies 200.3 $ Other Revenues 14.6 Reserve Funding 0.6 Total Revenues 215.5 $ Expenditures: Operating Costs 124.4 $ Allocated Centralized Support Costs 16.2 Debt Service Costs (Principal & Interest) 14.7 Contribution to Capital Program 60.2 Total Expenditures 215.5 $ Average Household Impact 180 $ Capital Expenditures: Infrastructure Growth 49.1 $ Infrastructure Maintenance 34.4 Infrastructure Risk Management 21.3 Infrastructure Upgrade 18.1 Opportunity Projects 3.1 126.0 $ Capital Funding: Reserves - Surplus 8.4 $ Long Term Borrowing 57.4 Contribution to Capital 60.2 126.0 $
SLIDE 34 34
Questions & Answers
SLIDE 35 Metro Vancouver 2016 Budget Overview
Council of Councils
Carol Mason Phil Trotzuk
CAO and Commissioner Chief Financial Officer
October 24, 2015
SLIDE 36 INTRODUCTION
2016 Budget Process
Evolving budget process
- Enhanced sense of budget accountability/ownership
- New budget software – enhanced development and review
Commenced preparation of 5 year financial plans
- Constructing 5 year plans – focus on 2016
- 5 year financial plans to be rolled out in late spring
- Longer term view – including assessment of financial policies
SLIDE 37
2016 BUDGET OVERVIEW
SLIDE 38
2016 BUDGET OVERVIEW
Expenditures
SLIDE 39
2016 BUDGET OVERVIEW
Revenue Sources
SLIDE 40 2016 BUDGET OVERVIEW
Capital Expenditures
($ millions)
2013 2014 2015 2016 Water $153.2 $189.3 $190.0 $179.5 Liquid Waste 78.6 84.9 92.1 126.0 Solid Waste 15.7 17.7 37.1 17.2 Housing 5.4 8.0 9.5 11.7 Regional Parks 12.7 13.5 13.1 12.0
Total Capital Expenditures $256.6 $313.4 $341.8 $346.4
SLIDE 41 2016 BUDGET OVERVIEW
Debt Management 2016
($ millions)
Funding provided by: 15 Year Debt Financing $180.1 52% Pay As You Go Financing Contributions from operations $115.4 Reserves (Housing & Regional Parks) 23.7 Applied surplus 27.2 166.3 48%
Total 2016 Capital Expenditures $346.4
SLIDE 42 2016 BUDGET OVERVIEW
Debt Management 2008-2014
Funding provided by:
($ millions)
15 Year Debt Financing $707.3 49% Pay As You Go Financing Contributions from operations $444.8 Reserves (Housing & Regional Parks) 92.6 Applied surplus 190.9 728.3 51%
Total 2008-2014 Capital Expenditures $1,435.6
SLIDE 43 2016 BUDGET OVERVIEW
Net Debt
($ millions)
Net Debt - 2008 $711.6 Net Debt - 2014 800.5 Change in net debt (2008 - 2014) $88.9 New capital assets (2008 – 2014) $1,435.6
SLIDE 44 2016 BUDGET OVERVIEW
2016 Household Impact1
2014 2015 2016 Water District $151 $154 $158 Liquid Waste 173 176 180 Solid Waste 58 57 56 Regional District 40 40 42
Total household impact $422 $427 $436
1 Average based on $760,000 assessed home value.
SLIDE 45 Water District $158
- 2016 Water Rate x Projected Average Consumption per Single /Multi-Family Dwelling m3
- $0.65 per m3 x 243m3 per household
Liquid Waste $180
Sewer Levy x Projected Average % Charged to Residential Sector of all Municipalities/ Total Number of Single and Multi-Family Dwellings2
- ( $200,250,619 x 67% ) / 748,342 residential dwellings
Solid Waste $56
- Municipal Tipping Fee x Average Tonnage per Single/Multi Family Dwelling
- ( $100 per tonne x 0.56 tonne )
Regional District $42
GVRD Tax Requisition x Average % Charged to Residential Sector of all Municipalities Total Number of Single and Multi-Family Dwellings2
- ( $49,844,842 x 63% ) / 748,342 residential dwellings
1 Average based on $760,000 assessed home value.
2 2015 BC Assessment
45
2016 BUDGET OVERVIEW
2016 Household Impact1
SLIDE 46
GREATER VANCOUVER WATER DISTRICT
WATER SERVICES
SLIDE 47 2016 WATER BUDGET
Operations Debt Service Contribution to Capital
($ millions)
2015 2016 $ Change % Change Operations $99.6 $100.1 $0.5 0.5% Debt service 93.7 98.2 4.5 4.9% Contribution to Capital 52.3 55.1 2.8 5.4%
Total expenditures $245.6 $253.4 $7.8 3.2%
Expenditures
SLIDE 48 2016 WATER BUDGET
Overview
2016 Key Actions Include
- Developing a Comprehensive Regional Water System Plan
- Identifying climate change impacts on infrastructure and develop adaptation strategy
- Securing additional water allocation from Coquitlam Source
- Commencing project definition for Coquitlam Intake No. 2 project
- Completing and commissioning of Port Mann Water Supply Tunnel
- Continuing the development of an Asset Management Plan
- Completing Alpine Lake Dam seismic assessments
2016 Major Capital Projects
- Port Mann Water Supply Tunnel ($32 M)
- Capilano Main No. 9 ($15 M)
- South Delta Main No. 1 Replacement ($14 M)
- Port Mann Main No. 2 – North (12 M)
- Clayton Reservoir ($10 M)
SLIDE 49 2016 WATER BUDGET
Household Impact
2015 2016 Total water sales $243.8 M $251.8 M Other revenues $1.8 M $1.6 M Total revenues $245.6 M $253.4M 3.2% Water rate average ($/m3) (Blended Rate) $0.64 $0.65 1.9%
$0.7270 $0.7407
$0.5816 $0.5926
2015 Proposed 2016 Household cost $154 $158 Impact on average household * $3 $4
* Average household assumed to use 243 cubic metres of water annually.
SLIDE 50 GREATER VANCOUVER SEWERAGE & DRAINAGE DISTRICT
LIQUID WASTE SERVICES
SLIDE 51
2016 LIQUID WASTE BUDGET
Expenditures
SLIDE 52 2016 LIQUID WASTE BUDGET
Overview
2016 Key Actions Include
- Identifying climate change impacts on infrastructure
- Completing procurement for the Lions Gate WWTP Secondary Upgrade
project
- Completing construction of Northwest Langley WWTP Upgrade
- Completing sustainability innovation projects at Annacis Research Centre
- Commencing construction of Annacis Island WWTP Stage 5 expansion
- Commencing removal of Iona Island WWTP biosolids stockpile
- Continuing development of an Asset Management Plan
2016 Major Capital Projects
- Annacis Island WWTP Stage 5 Expansion ($23.0 M)
- Northwest Langley WWTP Upgrade ($4.0 M)
- Gilbert Trunk Sewer Twinning ($9.4 M)
- Iona Island WWTP Solids Handling Facility ($5.0 M)
- Annacis Island WWTP Cogeneration Facility ($5.0 M)
SLIDE 53 2016 LIQUID WASTE BUDGET
Household Impact
($ millions)
2015 2016 Sewer levy1 $192.3 $200.3 User fees 2.5 2.5 BOD/TSS industrial charges 7.6 8.5 Other revenues 8.0 4.2 Total revenues $210.4 $215.5 2.4% 2015 Proposed 2016 Household cost $176 $180 Impact on average household2 $3 $4
1 Sewer levy increase includes the impact of population growth. 2 Average based on $760,000 assessed home value.
SLIDE 54 GREATER VANCOUVER SEWERAGE & DRAINAGE DISTRICT
SOLID WASTE SERVICES
SLIDE 55 2016 SOLID WASTE BUDGET
Expenditures
Operations Debt Service Contribution to Capital
($ millions)
2015 2016 $ Change % Change Operations $91.8 $89.5 $(2.3) (2.5%) Debt service 1.4 1.3 (0.1) (6.2%) Contribution to Capital 0.0 0.0 0.0 N/A
Total expenditures $93.2 $90.8 $(2.4) (2.5%)
SLIDE 56 2016 SOLID WASTE BUDGET
Overview
2016 Key Actions Include
- Various waste reduction and recycling initiatives (bans program, waste composition
work, recycling depot standards etc.)
- Procurement for transfer station third party operator
- North Shore Transfer Station reconfiguration
- Waste-to-Energy Facility initiatives
- Surrey Residential Drop-Off and Coquitlam Transfer Station replacement process
2016 Major Capital Projects
- Surrey Residential Drop-Off, Coquitlam Transfer Station replacement, and North
Shore Transfer Station reconfiguration work
- Various existing WTE facility projects
- Coquitlam Landfill projects
SLIDE 57 2016 SOLID WASTE BUDGET
Household Impact
($ millions)
2015 2016
User fees (tipping fee) $75.8 $80.0 Energy sales 6.1 5.7 Other revenues 11.3 5.1 Total revenues $93.2 $90.8 (2.5%) Tipping Fees /cubic metre
$130 $133
$109 $112
$80 $80
N/A $100 2015 Proposed 2016 Household cost $57 $56 Impact on average household* ($1) ($1)
* Average household assumed to produce 0.56 metric tonne annually.
SLIDE 58 GREATER VANCOUVER HOUSING CORPORATION
HOUSING SERVICES
SLIDE 59 2016 MVHC BUDGET
Expenditures
Operations Debt Service Contribution to Capital
($ millions)
2015 2016 $ Change % Change Operations $23.2 $24.5 $1.3 5.6% Debt service 15.5 15.2 (0.3) (2.2%) Contribution to Capital 1.0 0.9 (0.1) (9.1%)
Total expenditures $39.7 $40.6 $0.9 2.2%
SLIDE 60 2016 MVHC BUDGET
Overview
2016 Key Actions Include
- Executing 2016 capital replacement and upgrading plan projects
- Heather Place Re-development Phase 1 Construction starts / Redevelopment
Priority Plan
- Energy Upgrades including boiler replacements and common area LED lighting
conversions
- Increasing market rents by 2.9% - Residential Tenancy Act maximum
2016 Major Capital Projects
- Next phase of Heather Place Redevelopment ($5.7 M)
- Capital Replacement - Routine upgrades to flooring, kitchens/bathrooms ($2.0 M)
- Capital Replacement - Major works include Regal Place and Tivoli Garden envelope
repairs, roofing at Kingston Gardens, Tivoli Place and Alderwood ($4.0 M)
SLIDE 61
GREATER VANCOUVER REGIONAL DISTRICT
SLIDE 62 2016 REGIONAL SERVICES BUDGETS
Expenditures
($ millions)
2015 2016 Change Policy, Planning and Environment: Air Quality $8.5 $9.0 5.5% Regional Parks 33.0 34.4 4.3% Regional Planning 2.9 3.2 9.7% Electoral Area Service 0.5 0.6 13.5% Other Regional Services* 20.6 21.9 6.4%
Total expenditures $65.5 $69.1 5.4%
* Includes E911, General Government, Labour Relations, Regional GPS, Sasamat VFD
SLIDE 63 2016 REGIONAL SERVICES BUDGETS
Overview
2016 Air Quality Key Actions Include
- Developing and implementing integrated regional climate action strategy
- Implementing a regional approach to climate change adaptation
- Implementing additional energy and greenhouse gas reduction projects
- Developing new air quality bylaws and regulations for the protection of human
health 2016 Regional Planning Key Actions Include
- Preparing and implementing a strategic communication strategy and municipal
and public outreach strategy
- Conducting livability survey
- Developing tools and processes that contribute to agricultural land protection and
viability
- Preparing data and analytics strategy
SLIDE 64 2016 REGIONAL SERVICES BUDGETS
Overview
2016 Regional Parks Key Actions Include
- Completing Regional Parks Plan update
- Completing construction of Kanaka Creek Watershed Stewardship Centre
- Completing construction of Surrey Bend Regional Park facilities and hold official
- pening
- Construction of Colony Farm Regional Park Sheep Paddocks trail
2016 Regional Parks Major Capital Projects
- Heritage Parkland Acquisition Fund ($4.0 M)
- Colony Farm Sheep Paddocks Trail($2.0 M)
- Kanaka Creek Watershed Stewardship Centre ($1.9 M)
SLIDE 65 2016 REGIONAL SERVICES BUDGETS
Overview
2016 Electoral Area Service Key Actions Include
- Prepare a compendium of policies and procedures
- Initiate development of a Official Community Plan
2016 Other Regional Services Key Actions Include
- Complete a Client Satisfaction Survey and develop a Members Only Website in
Labour Relations
- 2nd year of survey updating of the high precision monuments in Regional GPS
- Continue with enhancements to corporate budgeting system/process
- Commencing long-term financial planning process including a financial policy
review
SLIDE 66 2016 REGIONAL SERVICES BUDGETS
Household Impact
($ millions)
2015 2016 GVRD municipal tax requisition* $47.2 $49.8 5.7% Other revenues 18.3 19.3 Total revenues $65.5 $69.1 5.4% 2015 Proposed 2016 Household cost $40 $42 Impact on average household** $0 $2
* Overall GVRD tax requisition 4.2% higher than 2015 after accounting for 1.5% regional population growth; impact rounded to $2 **Average based on $760,000 assessed home value
SLIDE 67
SUMMARY
SLIDE 68 2016 BUDGET SUMMARY
Overview
2.3%
Total expenditure increase
$669.4M
Proposed 2016 budget
SLIDE 69 2016 BUDGET SUMMARY
Household Impact*
$9
Increase for the average household in 2016
$436
Average annual costs for all Metro Vancouver services
* Average based on $760,000 assessed home value.
SLIDE 70 70
Questions & Answers
SLIDE 71 Agenda
October 24, 2015 Council of Councils
Moderator Greg Moore, Chair , Metro Vancouver Board 10:45 am Regional Affordable Housing Strategy 11:05 am Lions Gate Secondary Wastewater Treatment Plant Project 11:25 am Water Management in Summer 2015 11:45 am 2015 Zero Waste Conference 11:50 am Roundtable and Closing Remarks Noon Adjournment
SLIDE 72 DRAFT REGIONAL AFFORDABLE HOUSING STRATEGY
Council of Councils
Allan Neilson
General Manager, Policy, Planning, Environment
October 24, 2015
SLIDE 73 Administer funding
- Metro 2040
- Regional Affordable Housing Strategy
- Metro Vancouver Housing Corporation
- Homelessness Partnering Strategy
Policy and planning Provide housing
Metro Vancouver Housing Roles
SLIDE 74
Annual Housing Demand Metro Vancouver
SLIDE 75
Metro 2040
SLIDE 76
- Increase the supply + diversity of modest cost housing
- Eliminate homelessness across the region
- Meet the needs of low-income renters
Regional Affordable Housing Strategy 2007
3 Goals
SLIDE 77
- Municipal Housing Action Plans
- Parking reductions
- Appropriate density
- Infill – secondary suites, laneway housing
- Importance of rental supply
- New purpose built rental supply
- Connection between affordable housing and transit
Accomplishments
SLIDE 78
Regional Affordable Housing Strategy Update Process
SLIDE 79
Housing Continuum
SLIDE 80 Draft RAHS Framework
VISION GOAL 1
Strategy 1.1
Metro Actions Municipal Actions Developer actions Provincial Actions Federal Actions
Strategy Strategy
SLIDE 81
Draft Vision
A diverse and affordable housing supply that meets the needs of current and future regional residents
SLIDE 82
Draft Goals
① Expand the supply and diversity of housing to meet a variety of needs ② Preserve and expand the rental housing supply ③ Meet housing demand estimates for low and moderate income renters ④ Increase the rental housing supply along the Frequent Transit Network ⑤ End homelessness in the region
SLIDE 83 83
Questions & Answers
SLIDE 84 Lions Gate Secondary Wastewater Treatment Plant Project Update
Council of councils
Simon So
General Manager, Liquid Waste Services October 24, 2015
SLIDE 85 Regulatory Drivers
- Metro Vancouver Integrated Liquid Waste and
Resource Management Plan (ILWRMP) approved in May 2011
- Canadian Wastewater Systems Effluent Regulations –
July 2012
85
Secondary treatment by December 31, 2020
SLIDE 86 Work Completed and Underway
- 2013 – Indicative Design - complete
- 2014 – Procurement Business Case - complete
- 2015 – Owner’s Engineer Contract - complete
- 2015 (Sept) – Request for Qualifications
(Design-Build-Finance) - underway
86
SLIDE 87 Project Schedule
87
Owner’s Engineer Retained DBF Contract Award Secondary Treatment Completed
SLIDE 88 Grant Funding Applications
- 2014 – Submittal to Province for New Building Canada Fund
- 2014 – 2015 – Meetings with Province and Federal Government
88
SLIDE 89 Grant Funding Applications
89
2015 (June)
- Application to PPP Canada for funding
- Awaiting Decision on “screened in”
- Meeting with new North Shore MPs
SLIDE 90 90
Questions & Answers
SLIDE 91 Water Management in Summer 2015
Council of Councils
Tim Jervis
General Manager, Water Services October 24, 2015
SLIDE 92 Outline
- What occurred in 2015
- How the regional system performed
- Response plan review
- Where we go next
SLIDE 93 Combination of Events
- Low snowpack
- Low inflows
- High temperatures
- Level 4 Provincial drought rating
- Wildfire management
SLIDE 94 Source Reservoir Storage
early May
from Coquitlam Lake
and earlier than normal
earlier than normal
normal range in September/October
SLIDE 95 Daily System Consumption
- Higher than normal demand in May/June
- Peak Day Consumption: 1.7 billion litres on July 2
- Water Shortage Response Plan escalated to Stages 2 and 3
- Target consumption set at 1.2 billion litres/day
SLIDE 96 System Performance
sprinkling reduced peak hour demand
kept pace with peak demand throughout the region
available for all essential uses
in-stream flow requirements from the source reservoirs
SLIDE 97 Water Shortage Response Plan Review
municipalities
- Engagement with stakeholders
- Immediate changes for 2016
- Broader changes for 2017
SLIDE 98 Demand Reduction Initiatives
Campaign
Campaign
case for regional water metering
SLIDE 99 Ensuring Sustainable Supply
allocation for the Coquitlam source as per the Coquitlam Water Use Plan
- Commence project definition for
infrastructure improvements to convey additional supply from the Coquitlam source
- Initiate environmental studies
associated with future raising of Seymour Falls Dam
SLIDE 100 100
Questions & Answers
SLIDE 101
SLIDE 102
2015 Zero Waste Conference
2015 Zero Waste Conference Video http://bcove.me/xby5g2c0
SLIDE 103
Thank you
SLIDE 104