agenda
play

Agenda Creating Equity Dashboards to Monitor Racial, Ethnic and - PDF document

Agenda Creating Equity Dashboards to Monitor Racial, Ethnic and Linguistic Disparities in Health Care Welcome, brief overview of the field, and the MGH DSC experience Dr. Alexander Green Lessons from the Disparities Leadership Program


  1. Agenda Creating Equity Dashboards to Monitor Racial, Ethnic and Linguistic Disparities in Health Care • Welcome, brief overview of the field, and the MGH DSC experience – Dr. Alexander Green Lessons from the Disparities Leadership Program • Alameda County Medical Center – Dr. Mini Swift Alexander R. Green, M.D., M.P.H. • University of Chicago Medicine and Associate Director, The Disparities Solutions Center Biological Sciences – Brenda Battle Senior Scientist, Mongan Institute for Health Policy Associate Professor of Medicine, Harvard Medical School Tuesday, March 12, 2013 10:45 AM-12:15 PM DSC Background and Mission (est. 2005) DSC Model: The Disparities Solutions Center is dedicated to developing  Collect Data and implementing strategies to eliminate racial and ethnic disparities in health care locally, regionally, and nationally.  Identify/Report We aim to serve as an agent of change by:  Implement  Translating existing and ongoing research on strategies to Solutions eliminate disparities into policy and practice.  Evaluate  Developing and evaluating customized solutions to address disparities.  Strategic Planning  Providing education and leadership training to expand the community of skilled individuals dedicated to eliminating disparities.
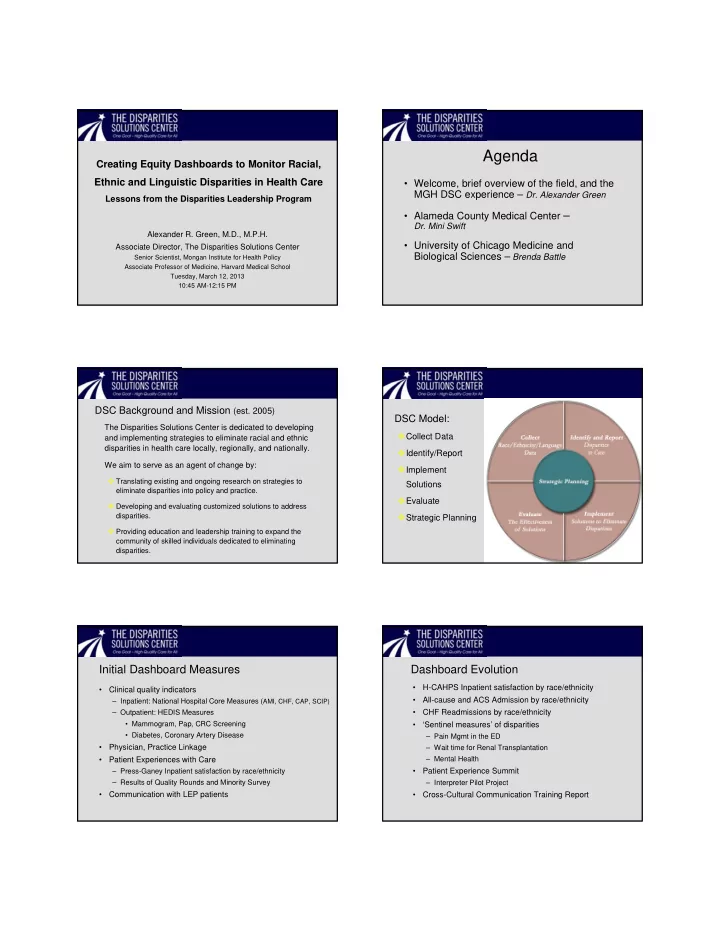
 Initial Dashboard Measures Dashboard Evolution • H-CAHPS Inpatient satisfaction by race/ethnicity • Clinical quality indicators • All-cause and ACS Admission by race/ethnicity – Inpatient: National Hospital Core Measures ( AMI, CHF, CAP, SCIP) • CHF Readmissions by race/ethnicity – Outpatient: HEDIS Measures • Mammogram, Pap, CRC Screening • ‘Sentinel measures’ of disparities • Diabetes, Coronary Artery Disease – Pain Mgmt in the ED • Physician, Practice Linkage – Wait time for Renal Transplantation • Patient Experiences with Care – Mental Health – Press-Ganey Inpatient satisfaction by race/ethnicity • Patient Experience Summit – Results of Quality Rounds and Minority Survey – Interpreter Pilot Project • Communication with LEP patients • Cross-Cultural Communication Training Report

  2. Disparities Dashboard Executive Summary – Green Light: Areas where care is equitable • Almost all National Hospital Quality Measures • Almost all HEDIS Outpatient Measures improvement • More linkage to PCPs – Orange Light: Disparities with gaps narrowing • Colonoscopy screening rates – Chelsea CRC Navigator Program (Latinos) • Breast cancer screening for refugees and immigrants – Chelsea Komen Breast Cancer Program for Refugees – Red Light: New areas of disparities, more work needed • Impact of limited-English proficiency (LEP) on patient safety • Patient Experience (H-CAHPS/CG-CAHPS) • Difference in readmission rates by race Accreditation, Quality Measures, and Reform The Disparities Leadership Program  Joint Commission: Disparities/cultural competence standards 2010-11  NCQA: Multicultural Recognition and new standards  Develop cadre of leaders in health care equipped with  National Quality Forum: Released cultural competence quality measures, – Knowledge of disparities, root causes, research-to-date developing disparities measures, incorporating into MAP  Health Care Reform has multiple provisions addressing disparities – Cutting-edge QI strategies for identifying/addressing disparities – Leadership skills to implement and transform organizations  Assist individuals and organizations to: – Create a strategic plan to address disparities, or – Advance or improve an ongoing project, and – Be prepared to meet new standards and regulations from the JC, NCQA, and health care reform, etc. DLP participants hail from 28 states, the Disparities Leadership Program Alumni Commonwealth of Puerto Rico, and Switzerland 190 participants 89 organizations • 44 hospitals • 19 health plans • 17 community health centers • 1 hospital trade organization • 1 federal government agency • 1 city government agency • 6 professional organizations Representation from 28 states, along with the Commonwealth of Puerto Rico and Switzerland

  3. Measuring Equity: Lessons Learned For More Information the Disparities Leadership Program U. Mini B. Swift MD MPH FACP www.mghdisparitiessolutions.org Alameda Health Systems Contact: Aswita Tan-McGrory, MBA, MSPH Deputy Director atanmcgrory@partners.org 617-643-2916 “To measure is to know”…“If you cannot measure it, you cannot improve it” Lord Kelvin, William Thompson, 1824 ‐ 1907 Core Measures Results Patient Experience Results Process Measures: Perspective Measures: Standardized, there How well do we serve all should be no variation. patients? ‐ 1 st Qtr improved ‐‐ No variation found that is not related to interpreter access = ↑ small sample size satisfaction in Asian sub group ‐‐ Small sample sizes. Measure over time ‐ Opportunity: Asian 10% Perfect Care Roll ‐ up less satisfied with “Communication about Medicines” Determining What to Measure Road Blocks Overloaded with "priority projects " Take an equity in operations approach Accurate Data Collection ‐ Use established metrics Provide new perspective on strategic priorities ‐ Compare internal and external demographic data collect ‐ REaL Registration Education Campaign – Process Measures: Limitations of Electronic Medical • Core Measures Granularity, Storage and Reporting – Perspective Measures ‐ Partner with IT and Patient Business Services • Patient Experience ‐ Community partnership to leverage – Outcome Measures buying power • Reducing Admission for Chronic ‐ Leverage national focus Disease Patients ‐ Advocate power of Disparities Solutions Center & Leadership Program

  4. Data Stratification Policy Policy Statement • Data stratified by race, ethnicity, language, gender, age and payer, will inform patient-centered care, culturally and linguistically competent care and services, and help to decrease health disparities/inequities. Timely, valid, and representative data collection is essential to the provision of quality and equitable care. Purpose of Policy • The purpose of this policy is to extend beyond collecting data on patient’s race, ethnicity, language, gender, age and payer for compliance reasons; it is to enable the use of this data to understand the Creating Equity Dashboards to Monitor Racial, Ethnic and health care needs of the populations served by BJH and to provide data to support our ability to plan Linguistic Disparities in Health Care: Lessons from the and customize programs and interventions to meet the needs of these populations, and to implement Disparities Leadership Program targeted, meaningful solutions to provide safe, quality care and improve health care outcomes. DiversityRx Workshop Brenda A. Battle, BSN, MBA March 12, 2013 Dashboards | 20 Creating the intersection between quality, safety Dashboard - readmissions and equity Readmit Rate 30 Day % 30 Day Gender Cas es Denom Cas es Readmit Cas es Readmit Male 18,810 18,279 3,324 18.18 Gender: F emale 22,908 22,428 3,806 16.97 Age Readmit Rate 30 Day % 30 Day Category Cas es Denom Cas es Readmit Cas es Readmit Equity indicators in clinical effectiveness 1-17 years 290 290 19 6.55 18-30 years 5,843 5,800 862 14.86 31-50 years 10,931 10,789 1,836 17.02 – Harm events - Patient safety indicators (BSI, pressure ulcer, 51-64 years 12,265 11,956 2,325 19.45 Age: >65 years 12,374 11,859 2,088 17.61 catheter-associated UTI, etc.) Readmit Rate 30 Day Readmit % 30 Day Race Cas es Denom Cas es Cas es Readmit – Care transition/care coordination – hospital readmissions Black 14,587 14,304 2,711 18.95 Multiracial 118 118 21 17.80 – Key external quality indicators Native american/es kimo 371 365 60 16.44 Other 614 583 67 11.49 Race: White 26,005 25,314 4,268 16.86 – Other ambulatory care sensitive conditions Readmit Rate 30 Day % 30 Day Hos pital Cas es Denom Cases Readmit Cas es Readmit Managed Care Readmits 13,361 13,072 2,111 16.15 Payor: Medicaid Readmits 8,523 8,403 1,553 18.48 Medicare Readmits 16,041 15,485 2,988 19.30 Dashboards | 21 Dashboards | 22 Predicting Targeting interventions toward populations Creating regression models that incorporates predictive variables to help identify a patient profile for 30-day readmissions, including indicators such as: • Patient demographics • Diagnosis • Community Health Needs Assessment – Community • Co-morbid conditions Benefit • Primary Care MD • Medications • # of Previous Admissions • Clinical effectiveness • Social determinants of health such as environment i.e., literacy levels, family support, environmental factors, etc. • Patient experience Evaluate data based on: • Consistent patient population focus • Consistent timeframes Dashboards | 23 Dashboards | 24

  5. Audience Questions and Answers

Download Presentation
Download Policy: The content available on the website is offered to you 'AS IS' for your personal information and use only. It cannot be commercialized, licensed, or distributed on other websites without prior consent from the author. To download a presentation, simply click this link. If you encounter any difficulties during the download process, it's possible that the publisher has removed the file from their server.

Recommend


More recommend