SLIDE 1
1
Ageing population: the impact on urban economies
Peter Karl Kresl Professor of Economics Emeritus Bucknell University
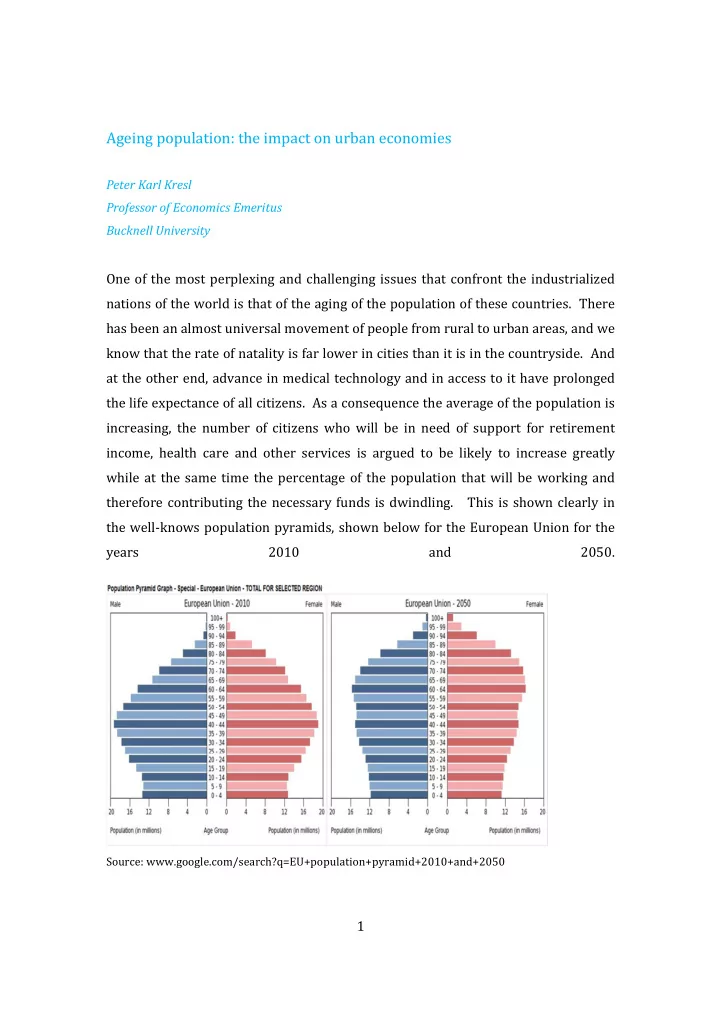
One of the most perplexing and challenging issues that confront the industrialized nations of the world is that of the aging of the population of these countries. There has been an almost universal movement of people from rural to urban areas, and we know that the rate of natality is far lower in cities than it is in the countryside. And at the other end, advance in medical technology and in access to it have prolonged the life expectance of all citizens. As a consequence the average of the population is increasing, the number of citizens who will be in need of support for retirement income, health care and other services is argued to be likely to increase greatly while at the same time the percentage of the population that will be working and therefore contributing the necessary funds is dwindling. This is shown clearly in the well-knows population pyramids, shown below for the European Union for the years 2010 and 2050.
Source: www.google.com/search?q=EU+population+pyramid+2010+and+2050
SLIDE 2 2 Between the two years, the relationship between the working age population, roughly the 20-65 year old cohort (workers) and that of those 65 and
- lder (seniors) has changed for the worse. That is to say that the working citizen of
the EU county will have to pay for his/her own living costs as will as an increased burden for those who are no longer working. This is shown clearly by the age dependency ratios shown below. Each EU senior will have less than two workers generating the tax revenues for his/her support, while in the US workers fare much better with three of them supporting each senior. The total age dependency figures, relating workers to the total of seniors and those under age 20, are even more favorable for US workers. While the US and EU figures are closer together, this is because the US has more young people as a share of the population and they will then be the next generations of taxpayers. One consequence of these figures could be a desire on the part of EU workers to escape their burden by emigration to the US, Canada, Australia or New Zealand, the so-called ‘lands of recent settlement’. Age dependency ratios - 2050 Old age US 32.6 3.06 workers per 65+ EU 50.42 1.98 “ Total (Old age + Young age) US 61.6 1.62 workers per 65+ and under 15 EU 75.01 1.33 “ It is quite natural that many would consider this situation to be that of a ‘ticking time bomb’, with the fiscal situation blowing up in Europeans’ faces. However it is the position of this author that this is to some extent a mistaken fear.
SLIDE 3
3 The European Commission and the US Bureau of the Census have argued that the current and coming generations of seniors should properly be describes as being ‘healthier, wealthier, better educated and more mobile’ that ever in human history’.1 This being the case, the ticking time bomb might better be referred to as a resource to be exploited. The following figures depicting the “life-long net contribution to society” of individuals can be used to clarify this notion. 2 The common understanding is represented by the excess of ‘cost to society’ over ‘contribution to society’ at the left of the figure – the years between birth and employment. During these years we give pleasure, one hopes, to our parents but make no other contribution to society, while we require resources to feed, cloth, entertain and educate us. With employment the contribution to society exceeds the cost to society
Life-long net contribution to society - 1
Contribution to society (-) (+)
(-)
Cost to society Age 20 40 60 80 90 The area "abc" is the potential gain to an urban economy from an aging population Blue line above the black line indicates a net cost to society. Black lilne above the blue line indicates a net contribution to society.
1 US Census Bureau, “Dramatic Changes in U.S. Aging Highlighted in New Census,
HIH Report,” Washington: Department of Commerce, US Census Bureau, March 9, 2006, pp. 1-2; Commission of the European Communities, Confronting Demographic Change: A New Solidarity Between the Generations (Green Paper), Brussels: Commission of the European Communities, March 16, 2005, p. 9.
2 This analysis can be found in: Peter Karl Kresl and Daniele Ietri, The Aging of the
Population and Urban Economies, Cheltenham: Edward Elgar Publishers, 2010.
SLIDE 4
4 as we provide for our own needs and contribute taxes for government services. Upon retirement, at age 65 perhaps, the cost to society falls and our demands for social services increase to the degree that we impose a net cost to society. Our youth and age are supported, ideally, by our taxes paid during our working years. For workers for whom the ‘healthier, wealthier, better educated and more mobile” description holds true we see from the second figure that our contribution to society rises while the cost to society falls, for reasons to be examined shortly, leaving a net positive contribution to society far beyond the year of retirement until perhaps the age of 75 or 80 – the area on the right marked (+). This casts an entirely different light on the situation – perhaps for at least some of the seniors this age group can better be considered to be a resource to be tapped.
Life-long net contribution to society - 2
Contribution to society b (+) c (-) (+) a
(-)
Cost to society Age 20 40 60 80 90 The area "abc" is the potential gain to an urban economy from an aging population Blue line above the black line indicates a net cost to society. Black line above the blue line indicates a net contribution to society.
Recognition of this enables one to suggest that there are actually four categories of seniors. First, those who are in the healthy, wealthy, educated and mobile group. It has been said that ‘retirement begins when the dog dies and the children leave home’. Research tells us that upon retirement seniors tend to move
SLIDE 5
5 from a big house in the suburbs to an apartment or condo in the city center. This brings a rejuvenation of the city center through an aging of the population. These seniors also tend to spend their time and money on cultural events – look at the audience of a classical music concert or the visitors to an art museum, and on life- long educational learning activities. Both of these activities add to the city’s identification as a city of culture or of learning or of research – all important for the city’s competitiveness. Finally, it must be noted that these seniors do not save, they spend – important for aggregate demand. Second, are other white-collar professional workers, ranging from accountants to travel agents. This cohort has adequate income due to their salaries and employer programs. They will require some health maintenance, they are interested in social groups and travel, but they are somewhat less interested in culture and education. Third, are workers in mining and manufacturing who had rough working experiences and have bodies that have been stressed by physical labour. Their income will be inadequate and they will require governmental assistance. They will probably tend to be sedentary and observers in need of social assistance, rather than active participants in activities. Fourth, are individuals who have been state-dependent since birth, due to a mental or physical condition or an unfortunate childhood situation that has made it difficult if not impossible for them the be active participants and contributors in society’s economic activity. When we consider seniors as composed of these four groups rather than as a uniform dependent population cohort, we can see that the determination of the fiscal impact on society will be more nuanced than is commonly thought. The issue becomes: what will be the population of each of the four cohorts in the years to come and what demands will they place on social and public services? While I have yet to do a statistical survey of this question, the following would appear to be a good approximation of what one would find. The skilled, education-based jobs will increase so that Category 1 seniors will increase the most. White-collar jobs should also increase a bit, so it is likely that Category 2 seniors will also increase in number.
SLIDE 6 6 Mining and manufacturing jobs should continue to decline in the decades to come so that Category 3 seniors will actually decline as a share of the population. Finally, Category 4 seniors should not change much unless we see significant improvements in medical technology and access to treatment. While Category 1 will increase the most, its demands for social expenditures should not pose a financial problem for society. In fact, these individuals may be expected to continue to contribute to society economically until they reach age 75 or
- 80. We should anticipate that Category 2 seniors will require some assistance for
health maintenance, recreation and other social programs. More significant claimants for social resources will be seniors in Category 3, however, their numbers should decline in the future. Finally, Category 4 seniors will continue to make major demands for social, income and social services. Two of the charges to participants of this panel were to estimate the demands for social services and to determine the optimal business plan to meet these demands. This estimation will be possible only after one has determined statistically the size and composition of each of the four categories of seniors and the demands they will impose. Once their claims on society have been ascertained we will then be able to design business models for the optimal delivery of these services. The final objective of this paper is that of ascertaining just where cities come into all of this. Without knowing the actual demands placed by seniors on society the impact on cities and their responsibilities can only be discussed in generalities. First, it is clear that the cities are the places where the services will have to be
- rendered. The mayor of Udine, Italy, has told this group that in his city there are
abandoned military barracks that can be converted to housing for homeless, for needy seniors, and for migrants and refugees. This may well come to be a quite common occurrence. Second, The funding for most of the required social programs will have to come from higher levels of government – from national and sub- national governments, and even from supra-national levels such as the EU. This is complicated by the third factor – national governments throughout the EU have adopted the fiscal posture of austerity. This is the idea that if one cuts government
SLIDE 7 7 back far enough, private sector forces will be unleashed that will cause dramatic increases in output, incomes, and GDP; the policy has been largely in effect since 2008 and has had zero impact to date. Its continuation will only cause greater burdens on city governments and on needy seniors. The fourth factor that will have an impact on cities’ ability to meet the needs of seniors is the fact that the EU is currently, and will probably be for the foreseeable future, being inundated by migrants and refugees from the Middle East and from Africa. The final factor is the fact that cities will be hosts to these populations. The financial demands this will generate will represent an extraordinary burden on funds available, and on staffing and physical facilities for social agencies that will make it difficult to meet the needs
- f Category 3 and Category 4 EU resident seniors.
It must be noted that EU nations, sub-national governments and cities do not function in accordance with one model of operation. Social programs in Stockholm are funded and provided in a way that is quite different from those in Turin, or Barcelona, or Rotterdam. Hence at this early stage of analysis it will not be possible to be at all precise as to how provision for the needs of EU resident seniors will be managed in the future and what the composition and funding of programs will be in
- reality. This will require further study.