SLIDE 1
Adverse Childhood Experiences Presentation Graphics
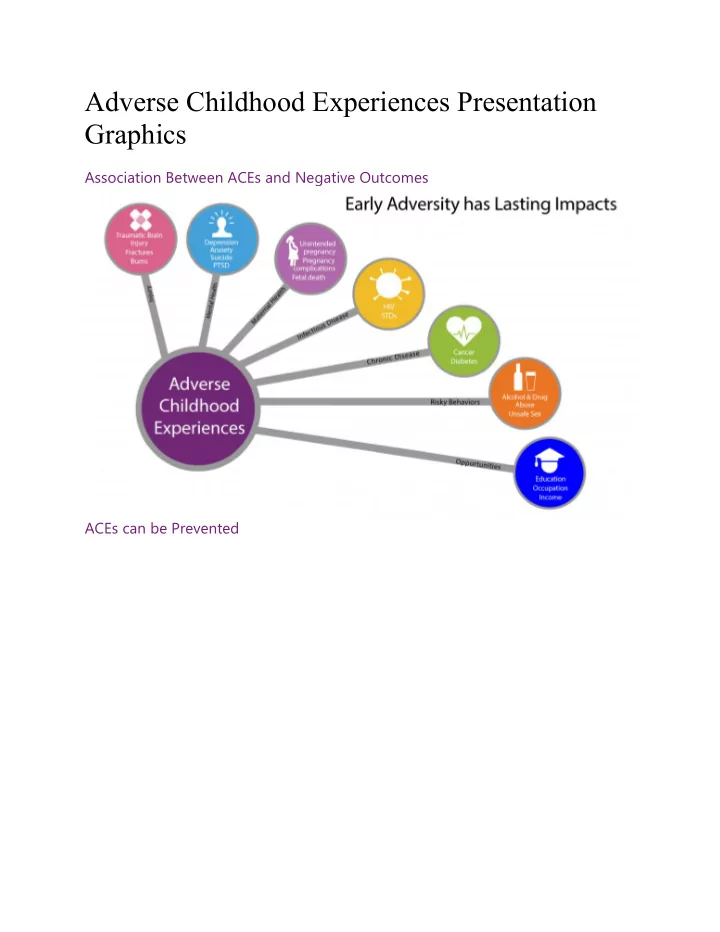
Association Between ACEs and Negative Outcomes ACEs can be Prevented
SLIDE 2
Source: Fortson, B. L., Klevens, J., Merrick, M. T., Gilbert, L. K., & Alexander, S. P. (2016). Preventing child abuse and neglect: A technical package for policy, norm, and programmatic activities. Atlanta, GA: National Center for Injury Prevention and Control, Centers for Disease Control and Prevention.
The ACE Pyramid
SLIDE 3 CDC-Kaiser Prevalence of ACEs
Prevalence of ACEs by Category for CDC-Kaiser ACE Study Participants, Waves 1 and 2.
SLIDE 4 Note: Research papers that use Wave 1 and/or Wave 2 data may contain slightly different prevalence estimates. Source: Centers for Disease Control and Prevention, Kaiser Permanente. The ACE Study Survey Data [Unpublished Data]. Atlanta, Georgia: U.S. Department of Health and Human Services, Centers for Disease Control and Prevention; 2016.
How Common are ACEs
ACE Score Prevalence for CDC-Kaiser ACE Study Participants, Waves 1 and 2.
SLIDE 5
Note: Research papers that use Wave 1 and/or Wave 2 data may contain slightly different prevalence estimates. Source: Centers for Disease Control and Prevention, Kaiser Permanente. The ACE Study Survey Data [Unpublished Data]. Atlanta, Georgia: U.S. Department of Health and Human Services, Centers for Disease Control and Prevention; 2016.
The ACE Study Continues
SLIDE 6 States Collecting BRFSS ACE Data by Year, 2009-2018.
BRFSS Prevalence of ACEs Prevalence of ACEs by Category for Participants Completing the ACE Module on the 2010-2014 BRFSS.
SLIDE 7
Note: Reports and articles that use data from other years and/or other states may contain different estimates. Source: Merrick, M.T., Ford, D.C., Ports, K. A., Guinn, A. S. (2018). Prevalence of Adverse Childhood Experiences From the 2011-2014 Behavioral Risk Factor Surveillance System in 23 States. JAMA Pediatrics, 172(11), 1038-1044.
How Common are ACEs on BRFSS ACE Score Prevalence for Participants Completing the ACE Module on the 2011-2014 BRFSS.
SLIDE 8
Note: Reports and articles that use data from other years and/or other states may contain different estimates. Source: Merrick, M.T., Ford, D.C., Ports, K. A., Guinn, A. S. (2018). Prevalence of Adverse Childhood Experiences From the 2011-2014 Behavioral Risk Factor Surveillance System in 23 States. JAMA Pediatrics, 172(11), 1038-1044.