
SLIDE 1
1
Presentation at the Food Security & Agriculture Cluster
15th Jan 2013
ACF food security assessment in Hodeida and Hajjah governorates
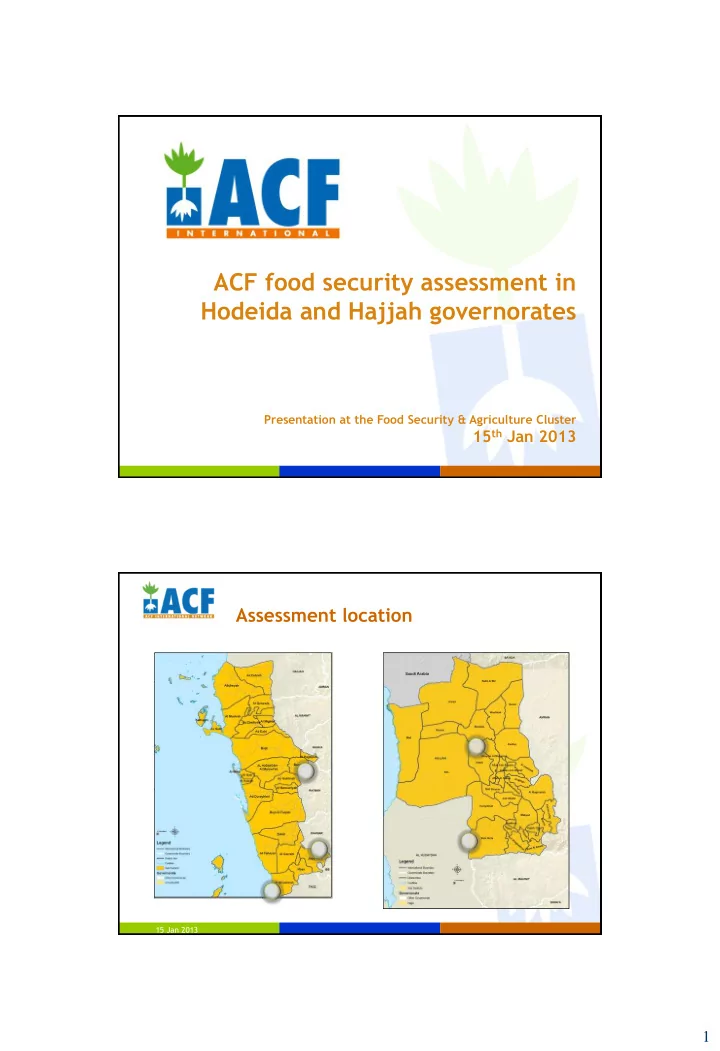
Assessment location
15 Jan 2013
ACF food security assessment in Hodeida and Hajjah governorates - - PDF document
ACF food security assessment in Hodeida and Hajjah governorates Presentation at the Food Security & Agriculture Cluster 15 th Jan 2013 Assessment location 15 Jan 2013 1 Assessment tools District # Households Market Key informant Focus
15 Jan 2013
District # Households interviews Market surveys Key informant interviews Focus Group discussions
Al Khawkhah 87 (68 Male HH; 19Female HH) 3 5 10 (5 male, 5 female) Jabal Ras 132 (97 male HH; 35 Female HH) 7 7 10 (5 male, 5 female) Bura 134 (96 male HH; 38 Female HH) 7 6 10 (5 male, 5 female) Aslem 138 (100 male HH; 38 female HH) 3 5 14 (8 male, 6 female) Bani Qais 214 (146 male HH; 68 Female HH) 6 6 10 (6 male, 4 female) Totals 705 HH (507 male HH; 198 female HH) 26 29 54 (29 male, 25 female)
15 Jan 2013 15 Jan 2013 4
15 Jan 2013 5
15 Jan 2013 6
15 Jan 2013 7
0.00% 20.00% 40.00% 60.00% 80.00% 100.00% 120.00% Al Khawkhah Jabal Ras Bura Bani Qais Aslem
Less than 9 mths More than 9 mths 15 Jan 2013 8
15 Jan 2013 9
15 Jan 2013 10
District Severely food insecure (poor) Moderately food insecure (borderline) Food secure (acceptable) Al-Khawkhah 15.3% 29.4% 55.3% Jabal Ras 13.6% 34.8% 37.8% Bura 23.6% 37.8% 38.6% Bani Qais 22.9% 39.5% 37.6% Aslem 23.3% 43.6% 33.1%
15 Jan 2013 11
15 Jan 2013 12