abiotic stress: an overview N. Ollat, E Marguerit, F. Lecourieux, A. - - PowerPoint PPT Presentation

abiotic stress an overview
SMART_READER_LITE
LIVE PREVIEW

abiotic stress: an overview N. Ollat, E Marguerit, F. Lecourieux, A. - - PowerPoint PPT Presentation

Grapevine adaptation to abiotic stress: an overview N. Ollat, E Marguerit, F. Lecourieux, A. Destrac-Irvine, S. Cookson, V. Lauvergeat, F. Barrieu, Z. Dai, E. Duchne, G. Gambetta, E. Gomes, D. Lecourieux, C. van Leeuwen, T. Simonneau, L.


slide-1
SLIDE 1

Grapevine adaptation to abiotic stress: an overview

  • N. Ollat, E Marguerit, F. Lecourieux, A. Destrac-Irvine, S.

Cookson, V. Lauvergeat, F. Barrieu, Z. Dai, E. Duchêne, G. Gambetta, E. Gomes, D. Lecourieux, C. van Leeuwen, T. Simonneau, L. Torregrosa, P. Vivin, S. Delrot

slide-2
SLIDE 2

A big thank to a great staff

slide-3
SLIDE 3

Pollution, climate change and reduction of inputs Context

http://www.globalcarbonproject.org/

High incertainty More differences between seasons and dry and humid regions Increase of soil and air pollution : N2O, radiation, salinity, nutrient availability CO2 and temperature rise Precipitations and drought risks

slide-4
SLIDE 4

Any environmental conditions that reduce growth and yield below optimum levels (Cramer et al., 2011)

Abiotic stress :

  • Water, temperature, light,

chemical

  • Duration, intensity, time of
  • ccurrence
  • Multistress

Responses of plants:

  • Dynamic
  • Complex (reversible or not)
  • Organ specific

Abiotic stress

slide-5
SLIDE 5

Cramer et al., 2011

  • Cell wall metabolism
  • Water potential

gradients

  • Inhibition of cell growth
  • Inhibition of protein

synthesis/modification

  • f regulation
  • Energy metabolism
  • Sugar transport and

storage

General plant response to abiotic stress

epigenetic control

slide-6
SLIDE 6

Adaptation to abiotic stress

For a crop : to maintain yield and quality under adverse conditions For a perenial crop: to survive over years to extreme adverse conditions

Adaptation means both a « process » and a « status »

(Cooper and Hammer, 1996)

How to define adaptation ?

slide-7
SLIDE 7

escape, avoidance, tolerance, resistance

A process « to adapt » A status « to be adapted »

Genotype (or population) : a new combination of favorable alleles (or changes in the allele frequency

within a population)

Genotype : a given combination of favorable alleles Escape, avoidance, tolerance, resistance Across generations Short to life cycle of the individual Adaptation sensu stricto Constitutive Regulation = Acclimation (Plasticity of traits) Short term Long term Existing diversity Selective value Functional Developmental Genetic architecture Heritability Reversible Less reversible High WUE Gs = f (ψ) Stomatal density

slide-8
SLIDE 8
  • Identification of mechanisms underlying

acclimation and adaptation

  • Abiotic stress : drought, temperature, mineral

deficiencies…. when/where/how ?

  • Traits of interest for adaptation : final (yield,

quality) or intermediate (WUE, K/tartrate, developmental traits as phenology and root system)

Which targets ?

Some examples

slide-9
SLIDE 9
  • 0.3
  • 0.2
  • 0.1

0.0 0.1 0.2 0.3

  • 0.3
  • 0.2
  • 0.1

0.0 0.1 0.2 0.3 S1_20a G1_Ta SG_60a S1_40a S1_Ta GG_Ta SG_Ta SG_40a SG_40b SG_20a G1_40a GG_60a S1_Tb S1_40b G1_40b GG_60b GG_Tb S1_60a SG_Tb S1_40c S1_60b S1_20b GG_20a GG_60c G1_20a G1_Tb S1_60c GG_40a G1_40c SG_20b GG_20b G1_60a SG_40 GG_Tc G1_20b S1_Tc S1_20c SG_Tc SG_60b G1_60b GG_40b G1_60c G1_20c G1_Tc SG_20c SG_60c GG_20c GG_40c

  • 20
  • 10

10

  • 20
  • 10

10

PCA for gene expression

Principal component 1 (33%) Principal component 2 (25%)

110R RGM

C MWD LWD

Drought responses in roots

HWD

Days after treatment

  • 3

3 6 9 12 15 18 21 24

SWC (kg H2O/kg soil)

0.08 0.12 0.16 0.20 0.24 0.28 0.32

CTL LWD MWD HWD

Peccoux, 2011; Barrieu, unpublished

3 scion-rootstocks combinations CS/CS, CS/RGM, CS/110R Bordo platform 4 levels of soil water content during 2 weeks Root tips Microarrays NimbleGen

slide-10
SLIDE 10

PIP1.1-L PIP1.3/5-L PIP2.1-L ABF2-L SnRK2.6-L SnRK2.6-R

  • 1
  • 0.75
  • 0.5
  • 0.25

0.25 0.5 0.75 1

  • 1
  • 0.75
  • 0.5
  • 0.25

0.25 0.5 0.75 1

F2 (28 %) F1 (35 %)

ABA metabolism and regulatory pathway Aquaporins

Discriminant responses among genotypes

101-14 110R 140Ru 161-49 41B Mgt Grenache RGM SO4 Syrah

  • 12
  • 8
  • 4

4 8

  • 14
  • 10
  • 6
  • 2

2 6 10 14

F2 (28 %) F1 (35 %)

  • V. vinifera
  • V. berlandieri x V.

rupestris

  • V. riparia &
  • V. riparia x V. rupestris
  • Genotypes are grouped according to their

background

  • VviABF2, VviSnRK2.6, VviPIP1.1, VviPIP2.1 and Vvi

PIP1-3/5 in leaves are discriminant among genotypes

  • VviSnRK2.6 is the only root discriminant variable

P94, P114, P 164, P180, P181

Rossdeutsch, 2015; Rossdeutsch et al., 2016

slide-11
SLIDE 11

TTSW_07 TTSW_08 TTSW_09 Tr_WD_0809 TTSW_070809 Coefb_070809

RGM3

Tr_C_0809--

CS1

VMC6E10 VMC16D4 VMC9B5 VMC2E9 VMC4C6

Coefa_09 Coefb_09 NTRFTSW60%_09 NTRFTSW40%_09 Coefb_070809

CS5

NTRFTSW40%_07 NTRFTSW20%_07 NTRFTSW40%_070809 NTRFTSW20%_070809

RGM13

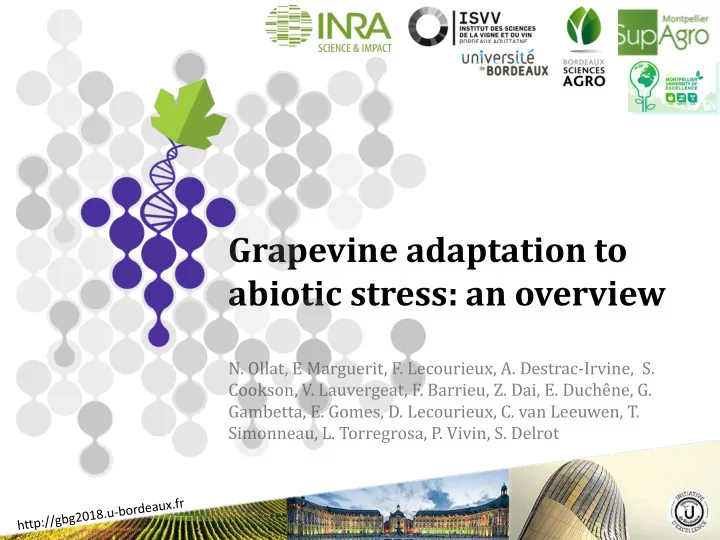
QTLs mapping for drought responses

VVMD7 0.0 VVIb22 16.8 VVMD6 25.9 VVIq06 45.8 VMC8D11 57.5 vvc10 62.1 VMC1A12 69.5 VVIq17 79.3 VVIv04 87.6

CR7

VMC2f12 0.0 VVC20 3.1 VVIp04 14.4 VVIv15a 20.6 VVIm07 24.8 VMC9F4x 28.2 VVIh02a 32.1 VMC1B11 52.1 VVIb66 64.9 VMC2H10 76.3

CR8

VMC2G2 VMC2H9 VMC4H5 VMC4G6 VMC5G1 IRT1f 0.0 VMC4f8 5.2 VVC19 16.5 VVIQ57 22.1 VVIb94 25.9 VVIn61 45.9 VVIs21 54.6 VMC9F2 72.6 VVIf52 81.6 VMC9D3 88.2

CR1

VVIB01 0.0 Male 13.0 Fem 13.1 VVIb23 15.4 VVIo55 26.3 VMC2C10 31.7 VMC5G7 43.5 VVIu20a 52.6 VVIU20 56.5 VMC7G3 64.3

CR2

VMC2E7 0.0 UDV021 16.1 VVIh02e 23.2 VMC3F3 24.3 VVMD36 25.6 VVIB59 25.7 VMC9F4cs 27.6 VVIn54 31.7 IRT1d 37.1

CR3

VMCNG1F1 0.0 IRT1a IRT1h2 4.0 VVIr46 6.7 VMC4D4 14.5 VMC7H3 16.2 VMC2b5a 33.6 VMC2b5c 34.8 VrZAG21 38.1 VVIn75 39.1 VMC2b5b 43.4 VRZAG83 61.0

CR4

VVC06 0.0 VVC22 9.3 VVII52 12.8 VVIt68 24.2 VVIv21 33.9 VVIn33 35.6 VMC6E10 37.7 VVC71 38.6 VMC16D4 43.8 VMC9B5 50.9 VMC2E9 62.4 VVIn40 65.4 VMC4c6 68.6

CR5

FRD3a 0.0 IRT1i 0.2 16.0 17.5 IRT1c 19.3 VVIc50 22.6 29.5 33.9 35.6 VVIp28 40.2 VVIn31 43.7 VVIp37 46.6 VVIm43 51.0 VVIs62 56.8

CR6

Marguerit et al., 2009; 2012

  • V. vinifera x V. riparia progeny

as rootstocks Bordo platform

Progesterone 5-beta reductase (POR) Predicted protein D4H, NCED Glutathione S transferase Alkanal reductase Class IV Chitinase Unnamed protein

Lipoxygenase (LOX)

Microsatellite linkage map

  • Transpiration
  • Water use efficiency
  • Responses to SWC
  • TTSW
slide-12
SLIDE 12
  • Transpiration
  • Plant conductance
  • Δ water potential
  • Water use efficiency

QTLs mapping for gas exchanges regulation under drought

PHENOARCH platform

Syrah x Grenache progeny

Coupel-Ledru et al., 2014; 2016; 2017

PHENOARCH platform

Transpiration Conductance Water potential gradients

slide-13
SLIDE 13

Developmental rate is related to temperature > thermal time

Heat Sum = Σ (Tmaxi-Tmin i)/2

From i = 60 to n. ( GFV model, Parker et al., 2011)

Heat Sum = Σ (Tmaxi-Tbase )

From i = 45 to n. Tbase = 2, 10, 6°C (Duchêne et al., 2010)

Temperature and phenology

Van Leeuwen and Destrac, 2017 Vitadapt

262 degree-days 21 days

slide-14
SLIDE 14

Developmental rate is related to temperature > thermal time

Heat Sum = Σ (Tmaxi-Tmin i)/2

From i = 60 to n. ( GFV model, Parker et al., 2011)

Heat Sum = Σ (Tmaxi-Tbase )

From i = 45 to n. Tbase = 2, 10, 6°C (Duchêne et al., 2010)

Temperature and phenology

Van Leeuwen and Destrac, 2017 Vitadapt

229 degree-days 14 days

slide-15
SLIDE 15

CA

Developmental rate is related to temperature > thermal time

Heat Sum = Σ (Tmaxi-Tmin i)/2

From i = 60 to n. ( GFV model, Parker et al., 2011)

Heat Sum = Σ (Tmaxi-Tbase )

From i = 45 to n. Tbase = 2, 10, 6°C (Duchêne et al., 2010)

Temperature and phenology

Van Leeuwen and Destrac, 2017 Vitadapt

506 degree-days 21 days P59, P83, P91, P154

slide-16
SLIDE 16

V V I r 4 6 . V M C 4 d 4 1 2 . 6 V M C 7 h 3 1 4 . 6 V r Z A G 2 1 3 7 . 2 V V I n 7 5 4 3 . 4 V V M D 3 2 5 3 . 3 V V I p 3 7 5 4 . 4 V M C 6 g 1 6 7 . 8

R I G W 4

GST1 GST2 V V I p 1 7 a . V M C 5 h 1 1 4 . 3 V V I p 1 1 1 8 . 8 V V I v 7 2 5 . 2 V V I p 3 1 2 6 . 6 V V I m 3 2 7 . 1 V V I p 3 4 4 1 . 7 V V I v 3 3 4 2 . 8 V M C 7 b 1 5 1 . 2

R I G W 1 9

VvWRKY3 GST3 GST4

Budburst

V V M D 7 . V r Z A G 6 2 3 . 2 V V M D 6 1 5 . 9 V M C 5 H 5 1 8 . 8 V V I v 3 6 . 2 3 . V M C 9 a 3 . 1 4 . 3 VMC8d11 5 6 . 7 V V I p 7 5 7 8 . 8 U D V 1 6 . 2 8 7 . 7 V V I n 5 6 9 2 . 1

R I G W 7

SGR7/SR LOBD39 VvFT Id1 VvSVP1 V V I p 5 _ G W . V V I p 5 _ R I . 8 V M C 9 c 1 7 . 7 V V I q 3 2 1 . 2 V V C 3 4 1 7 . 9 V M C 2 c 3 7 . 7 V V M D 2 4 . 8 V V I n 6 4 2 . 5 V V I p 2 6 5 . 5 V V I n 9 4 9 .

R I G W 1 4

VvFUL-L VvSEP1 VvCOL2 VvFLC2 V V I n 5 2 . V V I t 6 5 1 2 . 1 V V C 0 5 1 2 . 7 V M C 3 g 1 1 1 8 . 3 U D V 5 2 2 4 . 3 V V M D 3 7 4 4 . 9 V V M D 5 4 6 . 3 V M C 4 b 7

  • 2

5 3 . 7

R I G W 1 6

VvPYL VvHB10 V M C 2 a 3 . V V I v 1 6 9 . 4 V V I m 1 4 9 . 2 V V I u 4 5 6 . 6 V V M D 1 7 7 4 . 7 V V I n 1 6 8 3 . 1 V M C 7 f 2 9 1 . 2 V V I m 3 3 9 9 . 1

R I G W 1 8

VvSUT2-3 VvSUT2-2 VvMSA VvABF7

Flowering Véraison

Duchêne et al, 2012

Temperature and phenology

Riesling x Gewurtztraminer population Length of periods in DD

O25, O39, O40, O42, P3, P147, P153

slide-17
SLIDE 17

Grapevine Growth and Developmental Patterns and their Responses to Elevated Temperature N Luchaire, M Rienth, C Romieu, C Houel, Y Gibon, O Turc, B Muller, L Torregrosa, A Pellegrino

PI 10 PI 5 PI 25

VPD (2 kPa) PAR/14 h PP (560 µmol.m-2.s-1)

15°-35° Photo/Nyctiperiod

High T° either at night or day degrades energy supply Whole vine C balance

Torregrosa et al., 17th Meeting of ASEV-Japan, 10/6/2017, Kyoto, Japan

Temperature and development

Microvine Photosynthesis and respiration

O40, O59

slide-18
SLIDE 18

Torregrosa et al., 2017, Lecourieux et al., 2017

Temperature and berry development

Microvines Two temperature regimes (N/D) 22°C/12°C 30°C/20°C Heat stress +8°C (12h) 1 to 14 days Fruiting cuttings

slide-19
SLIDE 19

Fruiting cuttings (Cabernet Sauvignon)

Lecourieux et al., 2017  Transcriptomic analysis (Grapevine Nimblegen Arrays)  Proteomic analysis (Label-free LC-MS/MS)  Metabolomic analysis (LC-MS/MS)

Experimental design and sampling of heat stress exp

Temperature and berry acclimation

Heat stress

+8°C (12h) 1 to 14 days

slide-20
SLIDE 20

Nimblegen microarrays Vitis HX12K, (FC >2<, p-value < 0.05 with FDR correction) 3 stages x 3 biological replicates x 3 durations x 2 conditions (Control vs HS) = 54 samples

green HS_vs_control d1 green HS_vs_control d7 green HS_vs_control d14 26528 89 1765 107 45 14 124 139 up 26749 97 1561 149 60 16 104 75 down middle_ripening HS_vs_control d1 middle_ripening HS_vs_control d7 middle_ripening HS_vs_control d14 26661 515 336 144 558 59 350 188 up 27388 282 239 93 430 18 274 87 down veraison HS_vs_control d1 veraison HS_vs_control d7 veraison HS_vs_control d14 27208 464 127 87 593 95 96 141 up 27290 527 96 222 522 46 45 63 down

1d 573 DEGs 7d 4169 1d 1601 DEGs 7d 781 1d 1964 DEGs 7d 1646 14d 686 14d 1646 14d 1386 Middle GREEN VÉRAISON Middle RIPENING

Differentially expressed genes

GO category enrichment analysis:

  • Abiotic stress (Heat)
  • Cell Wall
  • Transport
  • Secondary metabolism
  • Protein homeostasis
  • Epigenetic processes

Lecourieux et al., 2017

slide-21
SLIDE 21

Green Veraison Ripening 7 500 DEGs

36

Putative key players of grape acclimation / adaptive responses to heat

1- HSFA2: master regulator of thermotolerance in plants 2- GOLS1: protection against abiotic stresses 1- Belong to key regulatory hubs in hormone and stress signalling in plants 2- No functional role assigned

  • HSPs
  • RLK
  • Enz. : VvGOLS1
  • FTs : VvHSFA2,

VvAP2/ERF, VvbHLH Signalling Secondary Metabolism Transport Epigenetic processes

HEAT TOLERANCE

Poster 127 P16

slide-22
SLIDE 22

Temperature desynchronizes sugar and organic acid metabolism in grapes and remodels their transcriptome

Malate/Tartrate

Individual berries

  • M. Rienth, L. Torregrosa, G. Sarah,
  • M. Ardisson1, J-M Brillouet, C. Romieu

Torregrosa et al., 17th Meeting of ASEV-Japan, 10/6/2017, Kyoto, Japan

Temperature and berry composition

Two temperature regimes (N/D) 22°C/12°C 30°C/20°C

P49

slide-23
SLIDE 23

Mapping fruit quality traits

New genotyping and phenotyping tools

Tartrate Potassium

C Houel, A Doligez, M Rienth, S Foria, N Luchaire, A Pellegrino, C Romieu, L Torregrosa Identification of stable QTLs for vegetative and reproductive traits in the microvine (Vitis vinifera L.)

Picovigne X Ugni blanc flb progeny

P61

slide-24
SLIDE 24

RixGW progeny, 2014

[Linalool] in microg/kg 500 1000 1500 2000

* *** ***

[Geraniol] (microg/kg) 2000 6000 10000 16E 204E 209E 210E 4071G 48E 4E 69E GW643 Ri49

*

Temperature and aroma profiles

15°C night/24°C day 21°C night/30°C day

Linalol Geraniol

Duchêne et al., unpublished

Riesling x Gewurtztraminer progeny Fruiting cuttings Two temperature regimes

P2, P43, P144

slide-25
SLIDE 25

L N CS LN HN 1103P 131 73 1 4 3

HN3 vs LN3 HN24 vs LN24

CS/1103P CS/RGM 383 58 66 45 155 665

HN3 vs LN3 HN24 vs LN24 136 76 212 Up Down Total 604 768 1369 Up Down Total

L N CS RGM LN HN LN 0 hpt 3 & 24 hpt LN HN 0,8 mM 5 mM Root tips RNA-Seq

  • 172 genes commonly and differentially expressed for the two

combinations (G6PDH, GS, NR, NIR)

  • For 1103P, a majority of DEG are related to nitrogen nutrition

(81%)

  • For RGM, more differentially expressed genes, and stronger

effects (induction or repression) (NRT2.4a, BTB, GTL1, NTF6.3, strigolactone biosynthesis)

  • Temporal differences between genotypes (ethylene)

Response to mineral nutrition

Cochetel et al., 2017; 2018

P75, P144, P175

slide-26
SLIDE 26
  • V. berlandieri
  • V. rupestris
  • V. riparia

Other

Greffadapt Cabernet-sauvignon P content in petiole at veraison

Variability for mineral content

Gautier et al., in process

Poster P99 O56, P76, P137, Poster 173

slide-27
SLIDE 27

Tandonnet et al., 2018

27

  • V. vinifera x V. riparia

138 individuals as rootstocks

Root system as a key parameter of adaptation

Root system as a key parameter

Poster 182

slide-28
SLIDE 28

Conclusions

  • Grapevine fit into the general model for abiotic

stress response mechanisms

  • Original results (new components in regulatory

pathways, genetic architecture of traits and analyses of diversity)

  • Which responses are leading to acclimation and

adaptation ?

  • Interactions between abiotic and biotic stress

responses ?

  • Highly polygenic traits ?
  • Modelling for phenotypes (P67) and genotype

(genomic selection P82)

slide-29
SLIDE 29
  • To re-enforce the hidden half community
  • Phylloxera Symposium in Bordeaux 2013
  • Root Symposium in Rauscedo 2014
  • Next….
  • To exchange about
  • Traits of interest
  • Phenotyping procedures and facilities
  • Genetic and genomic ressources
  • Specific approaches to analyse interactions (GxG, GxGxEaxEb)
  • To built common ressources
  • Genomic ressources dedicated to root and rootstock studies
  • Data bases of phenotypic traits related to root and roostock

performances

Proposal : a working group within IGGP An International Root and Rootstock Initiative ?

slide-30
SLIDE 30

Thank you for your attention