
SLIDE 1
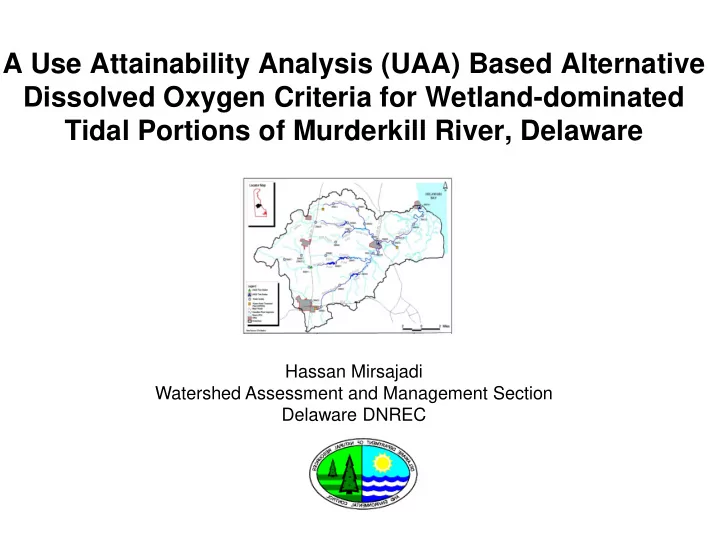
A Use Attainability Analysis (UAA) Based Alternative Dissolved Oxygen Criteria for Wetland-dominated Tidal Portions of Murderkill River, Delaware
Hassan Mirsajadi Watershed Assessment and Management Section Delaware DNREC
A Use Attainability Analysis (UAA) Based Alternative Dissolved - - PowerPoint PPT Presentation
A Use Attainability Analysis (UAA) Based Alternative Dissolved Oxygen Criteria for Wetland-dominated Tidal Portions of Murderkill River, Delaware Hassan Mirsajadi Watershed Assessment and Management Section Delaware DNREC Murderkill River
Hassan Mirsajadi Watershed Assessment and Management Section Delaware DNREC
– Agriculture (52%) – Wetland (17%) – Residential (16%)
– Discharge started in 1972 – Design capacity: 16.5 mgd – Current Discharge flow: 12 mgd
DO (mg/l) Dissolved oxygen (2001-2011)
was agreed to conduct a jointly-funded study with the goal of:
– Addressing scientific questions that were raised by the Kent County – Establishing site-specific DO criteria for tidal Murderkill River – And, if necessary, amend the TMDL
DNREC, Kent County, University of Delaware, University of Maryland, Stroud Water Research Center, Academy of Natural Sciences, USGS, and others
conducting research, and developing models with the ultimate goal
Murderkill River
County on a 50/50 basis
Bowers Beach Webb’s Marsh
20 40 60 80 100 120 140 2 4 6 8 10 12 VProd (µM C/d) Month
Station 10 Station 14 Station 16
Subtidal Marsh&Subtidal
210Pb-Dated
MK 01 MK 05 Geochron A MK 02 MK 05 Geochron B MK 03 MK 07 MK 04 MK 08 MK 09 MK 10 MK 04, MK 09, Geochron A Plot Together Subtidal Marsh&Subtidal
210Pb-Dated
MK 01 MK 05 Geochron A MK 02 MK 05 Geochron B MK 03 MK 07 MK 04 MK 08 MK 09 MK 10 MK 04, MK 09, Geochron A Plot Together
(Drs. William Ullman of UD and Anthony Aufdenkampe of Stroud)
Webb’s Marsh
build and calibrate a watershed and a hydrodynamic/water quality model.
Watershed Delaware Bay Tidal River
– For this scenario, all loads associated with human activities in the watershed were removed – Model results showed that dissolved oxygen concentration in the river increased only by 0.2-0.5 mg/l
11.8 12.3 9.6 7.0 4.5 3.3 3.2 2.4 4.8 7.7 9.8 11.6 12.1 12.5 9.9 7.5 5.0 3.5 3.4 3.3 5.6 7.2 10.4 12.0 0.00 2.00 4.00 6.00 8.00 10.00 12.00 14.00 Jan Feb Mar Apr May Jun Jul Aug Sep Oct Nov Dec DO 9mg/l) Zone 5 Calibration Zone 5 Natural 17
– For this scenario, all loads associated with tidal marshes were removed while other loads were set at the existing (2007-2008) levels. – Model results showed that dissolved oxygen in the river increased by about 2.0 mg/l.
19 11.8 12.3 9.6 7.0 4.5 3.3 3.2 2.4 4.8 7.7 9.8 11.6 11.8 12.4 10.0 8.1 6.0 5.2 6.1 5.5 6.4 9.5 10.2 11.9 0.0 2.0 4.0 6.0 8.0 10.0 12.0 14.0 Jan Feb Mar Apr May Jun Jul Aug Sep Oct Nov Dec DO (mg/l) Zone 5 Calibration Zone 5 No marsh load
– Daily average DO - 3.0 mg/L – 1-hour minimum DO - 1.0 mg/L
– 5.0 mg/L (daily average) – 4.0 mg/L (minimum at any time)