
SLIDE 1
A True Mining District Forward Looking Statement This presentation - - PowerPoint PPT Presentation
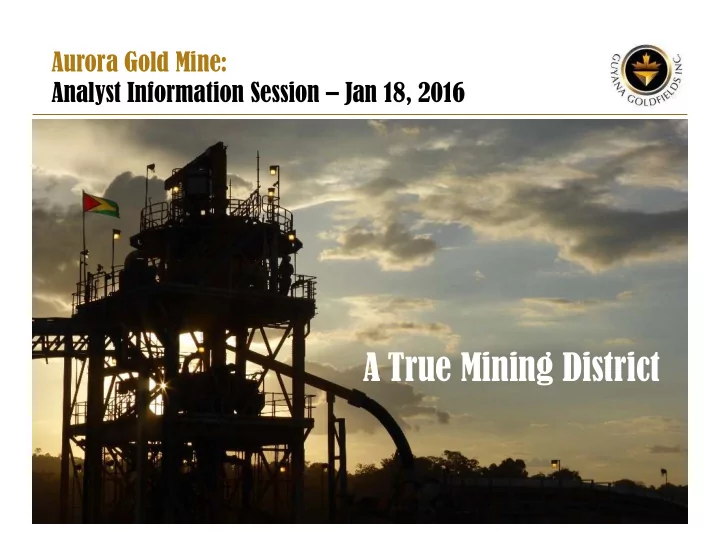
Aurora Gold Mine: Analyst Information Session Jan 18, 2016 A True Mining District Forward Looking Statement This presentation of Guyana Goldfields Inc. (the "Company") contains statements that constitute "forward looking
www.guygold.com 2
TSX : GUY
This presentation of Guyana Goldfields Inc. (the "Company") contains statements that constitute "forward‐looking statements." Such forward‐looking statements involve known and unknown risks, uncertainties and other factors that may cause our actual results, performance or achievements, or developments in our industry, to differ materially from the anticipated results, performance or achievements expressed or implied by such forward‐looking statements. Forward looking statements are statements that are not historical facts and are generally, but not always, identified by the words "expects," "aims," "plans," "anticipates," "believes," "intends," "estimates," "projects," "potential" and similar expressions, or that events or conditions "will," "would," "may," "could" or "should" occur. Information inferred from the interpretation of drilling results and information concerning mineral resource and mineral reserve estimates may also be deemed to be forward looking statements, as such information constitutes a prediction of what might be found to be present when and if a project is actually developed. Forward‐looking statements this document includes are statements regarding: the Company's expectations regarding drilling and exploration activities on properties in which the Company has an interest; and the Company's statements regarding estimates of reserves and resources on properties in which the Company has an interest. There can be no assurance that such statements will prove to be accurate. Actual results and future events could differ materially from those anticipated in such statements, and readers are cautioned not to place undue reliance on these forward‐looking statements that speak only as of their respective dates. Important factors that could cause actual results to differ materially from the Company's expectations include among others, risks related to fluctuations in mineral prices; uncertainties related to raising sufficient financing to fund planned work in a timely manner and on acceptable terms; changes in planned work resulting from weather, logistical, technical or other factors; the possibility that results of work will not fulfill expectations and realize the perceived potential of the Company's properties; uncertainties involved in the estimation of resources and reserves; the possibility that required permits may not be obtained on a timely manner or at all; the possibility that capital and operating costs may be higher than currently estimated and may preclude commercial development or render operations uneconomic; the possibility that the estimated recovery rates may not be achieved; risk of accidents, equipment breakdowns and labour disputes or other unanticipated difficulties or interruptions; the possibility of cost
with title to mineral properties; and other risks and uncertainties discussed appear elsewhere in the Company's documents filed from time to time with the Toronto Stock Exchange and Canadian securities regulators. These statements are based on a number of assumptions, including assumptions regarding general market conditions, the availability of financing for proposed transactions and programs on reasonable terms, and the ability of outside service providers to deliver services in a satisfactory and timely manner. Forward‐looking statements are based on the beliefs, estimates and opinions of the Company's management on the date the statements are made. Except as expressly required by applicable securities laws, the Corporation undertakes no obligation to update these forward‐looking statements in the event that management's beliefs, estimates or opinions, or other factors, should change. This presentation uses the terms "Inferred Resource", "Indicated Resource", “Measured Resource” and "Mineral Resource". The Company advises readers that although these terms are recognized and required by Canadian securities regulations (under National Instrument 43‐101 "Standards of Disclosure for Mineral Projects"), the US Securities and Exchange Commission does not recognize these terms. Readers are cautioned not to assume that any part or all of the mineral deposits in these categories will ever be converted into reserves. In addition, "Inferred Resources" have a great amount of uncertainty as to their existence, and economic and legal feasibility. It cannot be assumed that any part of an Indicated or Inferred Mineral Resource will ever be upgraded to a higher category. Under Canadian rules, estimates of Inferred Mineral Resources may not form the basis of feasibility or pre‐feasibility studies, or economic studies except for a Preliminary Assessment as defined and permitted under National Instrument 43‐101. Readers are cautioned not to assume that part or all of an Inferred Resource exists, or is economically or legally mineable. The Mineral Resources stated in this presentation are not Mineral Reserves and, in the absence of a current feasibility study, do not demonstrate economic viability. The determination of Mineral Reserves can be affected by various factors including environmental, permitting, legal, title, taxation, socio‐political, and marketing issues.
3
Financials @ 5% DR ($1,000/oz Au) Jan 2016 43‐101 FS Average Mill Throughput 5,000/6,040 tpd Strip Ratio 6.8:1 Average LOM Grade 2.94 g/t Au Gold Recovery 97%(sap), 94.4%(fresh) Total Gold Production 2.86 M oz Mine Life 16 yrs Avg Operating Cash Cost w/Royalty (LOM) US$564/oz AISC (LOM) US$661/oz 2016 Mill Expansion Capital US$5.6M Pre‐Tax NPV US$672M After‐Tax NPV US$568M Annual Production 2016E 130 – 150koz 2016 AISC Guidance US$587 – 637/oz Net Revenue US $2.7B
www.guygold.com TSX : GUY
TSX : GUY www.guygold.com 4
Aurora Gold Mineral Resource Statement – September 30, 2015
Classification Quantity Grade Contained Gold (000’ Tonnes) Gold ( g/t) (000’ Ounces) Open Pit Mining Measured 5,720 3.24 590 Indicated 26,780 2.51 2,160 Inferred 5,080 1.54 250 Underground Mining Measured Indicated 30,060 3.91 3,780 Inferred 11,810 4.12 1,560 Combined Mining Measured 5,720 3.23 590 Indicated 56,850 3.37 5,940 Inferred 16,890 3.80 1,810
Mineral resources are not mineral reserves and do not have demonstrated economic viability. All figures have been rounded to reflect the relative accuracy of the estimates. The cut‐off grades are based on a gold price of US$1,300 per ounce and metallurgical recoveries of ninety‐five percent for saprolite and fresh material. Open pit resources are reported within conceptual optimized open pit shells, whereas underground resources are external to these. Open pit resources are reported at a cut‐off grade of 0.30 g/t Au and 0.40 g/t Au for Saprolite and Fresh rock respectively, whereas underground resources are reported at a cut‐off of 1.8 g/t Au.
Aurora Gold Mineral Reserve Statement – September 30, 2015
TSX : GUY www.guygold.com 5
Classification Quantity Grade Contained Gold (‘000 tonnes) Gold (g/t) (‘000 ounces) Proven Open pit Saprolite 89 3.49 10 Open pit Fresh Rock 4,976 3.11 498 Total Proven 5,065 3.12 508 Probable Open pit Saprolite 3,543 2.02 230 Open pit Fresh Rock 9,000 2.87 832 Underground Fresh Rock 14,904 3.13 1,502 Total Probable 27,447 2.91 2,564 Total Proven and Probable 32,512 2.94 3,072
Mineral Reserves are based on a gold price of US$1,000 per ounce, 5% royalty and an average metallurgical recovery of 97.0% for saprolite and 94.4% for fresh rock material. Open pit saprolite rock reserves are reported at a cut‐off grade of 0.43 g/t Au and 0.41 g/t Au for vein and upper saprolite material respectively. Open pit fresh rock reserves are reported at a cut‐off grade of 0.75 g/t Au and 0.64 g/t Au for vein and Rory’s Knoll fresh rock material respectively. Underground fresh rock reserves are reported at a cut‐off grade of 1.62 g/t Au.
TSX : GUY www.guygold.com 6
Rory’s Knoll deposit expanding to 8,000 tpd in early 2017 with the inclusion of other open pit feeds from the Aleck Hill and Mad Kiss deposits.
TSX : GUY www.guygold.com 7
ranges from 5,000 - 8,000 tpd. After eight years of operation, open pit mining will be completed.
US$5.6M and is funded from free cash flow and is contingent upon economic conditions. Major components of the plant were built for a 10,000 tpd throughput rate allowing for lower expansion capital.
carbon, inter-tank, additional electrowinning cell, additional tailings pipeline and pump).
TSX : GUY www.guygold.com 8
TSX : GUY www.guygold.com 9
2022 as O/P mining operations are completed and sustains at 5,200 tpd for nine years.
two independent FEED proposals completed in 2015.
modeling confirmed that it is amendable to the top–down open benching and sublevel retreat mining methods accessed by a decline with diesel truck haulage.
deposit from -170 mRL to a depth of -770 mRL, starting with open benching and transitioning to SLR at the -395 mRL.
TSX : GUY www.guygold.com 10
Underground Mine Design – Isometric View
TSX : GUY www.guygold.com 11
TSX : GUY www.guygold.com 12
500 1,000 1,500 2,000 2,500 3,000 3,500 2015 2016 2017 2018 2019 2020 2021 2022 2023 2024 2025 2026 2027 2028 2029 2030 2031
Thousand Tonnes Per Year Years UG FRESH DF OP SAP S/P OP FRESH S/P OP FRESH DF OP SAP DF
TSX : GUY www.guygold.com 13
250 500 750 1,000 1,250 1,500 1,750 2,000 2,250 2,500 2,750 3,000 3,250 50 100 150 200 250 2015 2016 2017 2018 2019 2020 2021 2022 2023 2024 2025 2026 2027 2028 2029 2030 Thousand Ounces Years AU Recovered from Fresh Ore AU Recovered from SAP Ore Cumulative AU Recovered
averages 200,000oz/yr from years 2017 ‐ 2028 with a peak production
231,000 oz in 2023.
TSX : GUY www.guygold.com 14
the LOM.
2015 to 2019 is based on saprolite/fresh rock blend.
leaching, CIL, carbon desorption, and eluate electrowinning.
prior to tailings disposal. Tailings is pumped to an engineered tailing management area.
transportation off-site.
this feasibility study update.
plant expansion to handle higher throughput rate, open pit sustaining capital, expenditures required to develop the underground, underground sustaining capital and closure costs.
TSX : GUY www.guygold.com 15
Description LoM Total ($M) Years 2015‐2017 ($M) Years 2018‐2019 ($M) Years 2020‐2022 ($M) Years 2023‐2030 ($M) Years 2031‐2033 ($M) Open Pit Mine 37.9 18.8 16.0 3.1 0.0 0.0 Underground Mine 227.4 0.0 0.0 112.4 115.1 0.0 Processing Facilities 5.6 5.6 0.0 0.0 0.0 0.0 Closure Costs 9.0 0.0 0.0 0.0 0.0 9.0 Total Capital Costs 279.9 24.4 16.0 115.5 115.1 9.0
LOM ALL‐IN Costs Units January 2016 Updated Feasibility Study (LOM) Mining – (OP + U/G) US$/oz 287.22 Processing US$/oz 150.84 G&A US$/oz 75.42 Cash Cost US$/oz 511.48 Royalty US$/oz 50.00 Cash Cost w/ Royalty US$/oz 561.48 Sustaining Capital US$/oz 99.83 All‐In Sustaining Cash Cost US$/oz 661.32 ALL‐IN COST (AISC + G&A + Debt service) US$/oz 761.32 16
www.guygold.com TSX : GUY LOM Operating Costs Units January 2016 Updated Feasibility Study (LOM) Mining cost per tonne (open pit) US$/t 2.45 Mining cost per tonne to the Mill (open pit) US$/t 19.23 Mining cost per tonne (underground) US$/t 29.85 Processing cost per tonne US$/t 12.86 G&A cost per tonne US$/t 8.29
17
www.guygold.com TSX : GUY
cash flow of US$776.7M, and an NPV5% of US$568.0M.
Financials @ 5% Discount Rate Units
Gold Price Per Ounce in US$
$800 $900 $1,000 Base Case $1,100 $1,200 Average Operating Cash Cost (LOM) US$/oz 554 559 564 602 610 All‐In Sustaining Cost (LOM) US$/oz 651 656 661 699 707 Pre‐Tax NPV US$M 297 485 672 795 977 After‐Tax NPV US$M 278 435 568 656 784 After‐Tax Net Cash Flow1 US$M 371 590 777 901 1,086
www.guygold.com 18
TSX : GUY Assumed Gold Price/oz $1,000 $1,100 $1,200 Cash Balance @ Sept 30, 2015 $18.5M $18.5M $18.5M Restricted Cash $27.0M $27.0M $27.0M Total Proceeds $45.5M $45.5M $45.5M After Tax Cash From Operations* $92.7M $104.3M $121.3 2016 Debt Related Payments Principal Debt/Interest/Fees** $46.4M $47.5M $48.5M Debt Service Reserve Account Funding $25.4M $25.4M $25.4M Debt Reclamation Account Funding $4.9M $4.9M $4.9M Working Capital Deficiency $24.0M $24.0M $24.0M GGI Corporate Expenses G&A $4.9 M $4.9 M $4.9 M Exploration $2.0M $2.0M $2.0M Proceeds From Stock Options $3.5M $3.5M $3.5M Change in cash $15.5M $26.0M $41.9M Forecasted Closing Cash Balance @ Dec 31, 2016 $34.0M $44.5M $60.4M
*5% Royalty @ $1,000/oz, 8% Royalty > $1,000/oz, Includes Sustaining Capital ** Includes Accelerated Principal Repayments based on cash available
By end of 2016, US$35M (or 22%) of the total US$160M debt facility will be paid down, as well as, ~US$30M will be allocated to the debt reserve and reclamation accounts. GGI estimates that debt and principal payments can be retired as early as 2019 assuming a gold price of US$1,000/oz.
www.guygold.com 19
TSX : GUY Open Pit Mining (OP)
incorporating ore from the nearby Sulphur Rose deposit.
Underground Mining (U/G)
and Mad Kiss, is economically viable when the price of gold is equal or greater than $1,250 oz.
Processing
Economics
NPV (5% DR) of the Aurora gold project improve by 39% as compared to the current feasibility study update.
www.guygold.com 20
TSX : GUY
~1.1M oz in Indicated & Inferred Categories
Current Mine Plan Depth of ‐770m
2.9M oz in Indicated & Inferred Categories
Resources Found Outside Mine Plans
Rory’s Knoll Aleck Hill Walcott Hill Mad Kiss
Selected Intercepts: 1. RKD 162W-2: 639m @ 3.43 g/t Au from 989m, including 40m @ 7.74 g/t Au from 1,253m, including 50m @ 5.19 g/t Au from 1,301m, including 33m @ 5.21 g/t Au from 1,415m, including 12m @ 14.39 g/t Au from 1,495m, including 12m @ 10.69 g/t Au from 1,605m. 2. RKD 162W-3: 635m @ 2.08 g/t Au from 974m, including 48m @ 5.83 g/t Au from 1,520m, including 10m @ 17.17 g/t Au from 1,558m. 3. RKD 163: 124m @ 6.15 g/t Au from 1,939m, including 10m @ 10.80 g/t Au from 1,983m, including 32m @ 10.03 g/t Au from 2,007m. 4. RKD 162W-10: 35m@ 13.4 g/t Au from 1,316m 5. RKD 162W-7: 28m @ 10.41 g/t Au from 1,625m. 6. AHD-270: 72m @ 2.96 g/t Au from 647m, including 39m @ 5.27 g/t Au from 680m, including 14.50m @ 12.63 g/t Au from 704.50m. 7. AHD-172: 53m @ 3.59 g/t Au from 603m, including 24m @ 6.71 g/t Au from 603m, including 10m @ 10.28 g/t Au at 609m. 8. MKD-123: 29.5m @ 4.67 g/t Au, including 15.5m @ 7.58 g/t Au from 447.5m.
1 2 3 4 5 6 7 8
21
www.guygold.com TSX : GUY
22
www.guygold.com TSX : GUY
23
www.guygold.com TSX : GUY
24
www.guygold.com TSX : GUY
TSX : GUY www.guygold.com 25
After tax NPV5% of US$568M @ US$1,000 gold 6.5M oz M&I and 1.82M oz Inferred @ +3g/t Au Exceeding Expectations Servicing debt and cash balance is increasing 200,000 oz/yr producer from years 2017 ‐ 2028 Extensive mineralization beyond current plan
Management Region Country (government and community) Sustainability Aurora Gold Mine Fully Operational Experienced operations team in place Guiana Shield – known gold region Pro‐mining, excellent relations International standards with IFC Achieving all Milestones Aurora Gold Mine
Exploration Upside Large exploration land package
www.guygold.com 26
TSX : GUY
Scientific and Technical Information The qualified person for the mineral resource and reserve estimates and other scientific and technical information herein are as follows: Glen Cole, P.Geo. Jarek Jakubek, C.Eng., John Lambert, P.Geo., D Erik Spiller, MMSA and Richard Tocher, P.E, (the “QPs”) who are independent of the Company and have approved the contents of this presentation. The qualified person for the other scientific and technical information in this presentation, is Scott E. Wilson, CPG, of Metal Mining Consultants, a "qualified person" within the meaning of NI 43‐101. , and has approved the contents of this presentation. Technical and scientific information contained herein, including the mineral resource and reserve estimates relating to the Aurora Gold Project is derived from the “Updated Feasibility Study, Aurora Gold Project, Guyana, South America” dated January 29, 2013 (the “Technical Report”). We have filed the Technical Report under our profile at www.sedar.com. For details of the data verification procedures employed by the QPs and the key assumptions, parameters and methods used to estimate the mineral resource and mineral reserve estimates, please see the Technical Report. For information about known legal, political, environmental, or other risks that could materially affect the potential development of the mineral resources or mineral reserves, please see the Technical Report. Securities Laws This presentation does not constitute an offer or solicitation to buy or sell any securities discussed herein in any jurisdiction where such would be prohibited. This presentation is not an offer to sell, or a solicitation of an offer to purchase, any securities in the United States. The securities referred to in this presentation will not be registered under the U.S. Securities Act of 1933 and may not be offered or sold in the United States except pursuant to an exemption from the registration requirements of the U.S. Securities Act of 1933 and applicable state securities laws. The information contained in this presentation does not and is not intended to constitute a "valuation," "formal valuation," "appraisal," "prior valuation," or a "report, statement or opinion of an expert" for purposes of any securities legislation in Canada or otherwise. Currency Unless otherwise indicated, all dollar values herein are in United States dollars.