
SLIDE 1
College of Education
1
THREE REASONS WHY THE UO RECOMMENDED DIBELS NEXT BENCHMARK GOALS ARE NECESSARY
2
In this session we’ll answer the question: Why were the DIBELS Next recommended goals established?
4
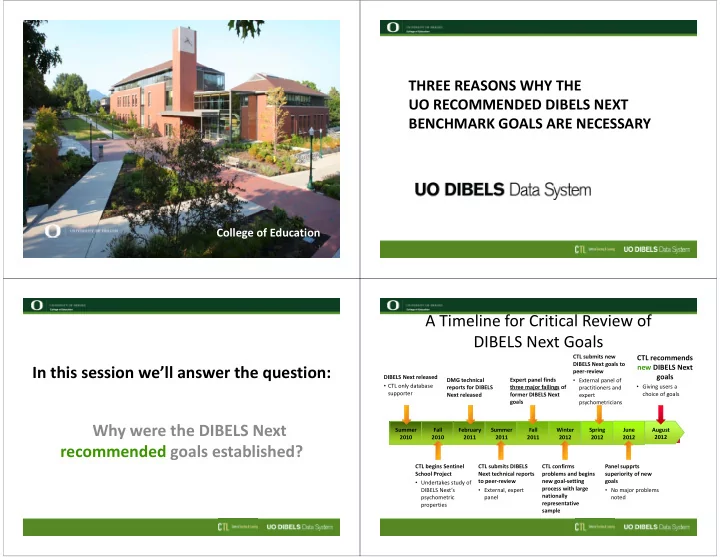
Fall 2010 February 2011 Summer 2011 Fall 2011 Summer 2010 Spring 2012 DIBELS Next released
- CTL only database
supporter DMG technical reports for DIBELS Next released Expert panel finds three major failings of former DIBELS Next goals CTL begins Sentinel School Project
- Undertakes study of
DIBELS Next’s psychometric properties CTL submits DIBELS Next technical reports to peer‐review
- External, expert
panel Panel supprts superiority of new goals
- No major problems
noted
A Timeline for Critical Review of DIBELS Next Goals
June 2012 August 2012 Winter 2012 CTL confirms problems and begins new goal‐setting process with large nationally representative sample CTL submits new DIBELS Next goals to peer‐review
- External panel of
practitioners and expert psychometricians
CTL recommends new DIBELS Next goals
- Giving users a
choice of goals