
SLIDE 1
1
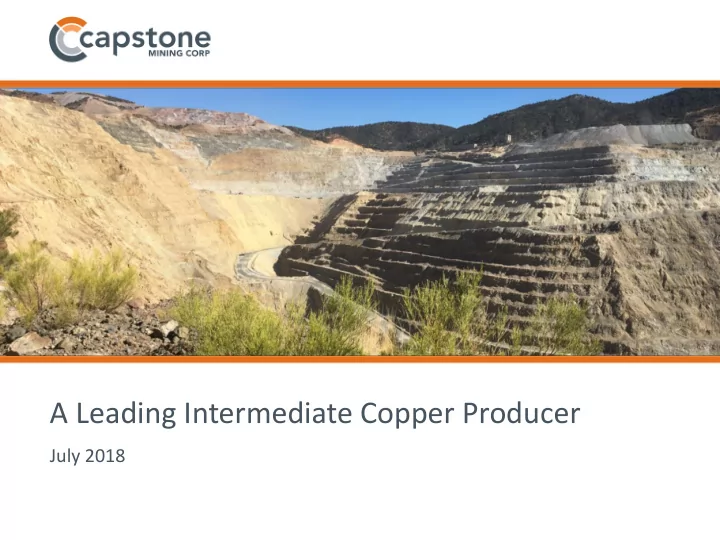
A Leading Intermediate Copper Producer July 2018 1 Cautionary Note - - PowerPoint PPT Presentation
A Leading Intermediate Copper Producer July 2018 1 Cautionary Note On Forward Looking Information This presentation, and the documents incorporated by reference herein, may contain forward - looking information within the meaning of
1
2
This presentation, and the documents incorporated by reference herein, may contain “forward-looking information” within the meaning of Canadian securities legislation and “forward-looking statements” within the meaning of the United States Private Securities Litigation Reform Act of 1995 (collectively, “forward-looking statements”). These forward-looking statements are made as of the date of this document and Capstone does not intend, and does not assume any obligation, to update these forward-looking statements, except as required under applicable securities legislation. Forward-looking statements relate to future events or future performance and reflect our expectations or beliefs regarding future events. Forward-looking statements include, but are not limited to, statements with respect to the estimation of mineral resources and mineral reserves, the realization of mineral reserve estimates, the timing and amount of estimated future production, costs
statements can be identified by the use of words such as “plans”, “expects”, “budget”, “scheduled”, “estimates”, “forecasts”, “intends”, “anticipates”, “believes” or variations of such words and phrases, or statements that certain actions, events or results “may”, “could”, “would”, “might” or “will be taken”, “occur” or “be achieved” or the negative of these terms or comparable
statements involve known and unknown risks, uncertainties and other factors that may cause our actual results, performance or achievements to be materially different from any future results, performance or achievements expressed or implied by the forward-looking statements. Such factors include, amongst others, risks related to inherent hazards associated with mining operations, future prices of copper and other metals, compliance with financial covenants, surety bonding, our ability to raise capital, Capstone’s ability to acquire properties for growth, counterparty risks associated with sales of our metals, use of financial derivative instruments and associated counterparty risks, foreign currency exchange rate fluctuations, changes in general economic conditions, accuracy of mineral resource and mineral reserve estimates, operating in foreign jurisdictions with risk of changes to governmental regulation, compliance with governmental regulations, compliance with environmental laws and regulations, reliance on approvals, licences and permits from governmental authorities, impact of climatic conditions on our Pinto Valley, Cozamin and Minto operations, aboriginal title claims and rights to consultation and accommodation, land reclamation and mine closure obligations, uncertainties and risks related to the potential development of the Santo Domingo Project, uncertainties related to the proposed transaction for the sale of Minto Explorations Ltd., increased operating and capital costs, challenges to title to
and bribery, limitations inherent in our insurance coverage, labour relations, increasing energy prices, competition in the mining industry, risks associated with joint venture partners, our ability to integrate new acquisitions into our operations, cybersecurity threats, legal proceedings and other risks of the mining industry as well as those factors detailed from time to time in the Company’s interim and annual financial statements and management’s discussion and analysis of those statements, all of which are filed and available for review under the Company’s profile on SEDAR at www.sedar.com Although the Company has attempted to identify important factors that could cause our actual results, performance or achievements to differ materially from those described in our forward- looking statements, there may be other factors that cause our results, performance or achievements not to be as anticipated, estimated or intended. There can be no assurance that our forward- looking statements will prove to be accurate, as our actual results, performance or achievements could differ materially from those anticipated in such statements. Accordingly, readers should not place undue reliance on our forward-looking statements.
Alternative Performance Measures
“C1 cash cost”, “cash cost”, “all-in sustaining cost”, “all-in cost”, “fully-loaded all-in cost”, “adjusted net income/loss”, “operating cash flow before changes in working capital” and “net debt” are Alternative Performance Measures. Alternative performance measures are furnished to provide additional information. These non-GAAP performance measures are included in this presentation because these statistics are key performance measures that management uses to monitor performance, to assess how the Company is performing, to plan and to assess the overall effectiveness and efficiency of mining operations. These performance measures may not be comparable to similar data presented by other mining companies. These performance measures should not be considered in isolation as a substitute for measures of performance included in the Company’s unaudited condensed interim consolidated financial statements prepared in accordance with IFRS.
Currency
All amounts are in US$ unless otherwise specified.
3
4
Operating mines in stable geographies in the Americas
71 k tonnes of copper in 2018 from continuing operations1 ➢ Santo Domingo
Region III, Chile CS 70%; KORES 30%
➢ Ongoing Exploration
Portfolio
Growth projects and base metals exploration
Short term Long term
➢ Pinto Valley
Arizona, US 56 k tonnes copper 1
➢ Cozamin
Zacatecas State, Mexico 15 k tonnes copper 1
➢ Minto Yukon, Canada
Sale expected to complete Q3 20182
5
➢ Production planned to increase throughout the year as grade and recoveries increase ➢ 2018 focus on overall plant stabilization and optimization to reduce costs
Mine life (years) 21 2018 Guidance Production1 (tonnes) C1 Cash Cost Guidance1,2,3 ($/payable lb produced) All-In Sustaining Cost1,2,3 ($/payable lb produced) 56,000 $1.90 - $2.00 $2.50 - $2.60 By-products Mo, Ag
and Cautionary Note for NI 43-101 information. 3. C1 cash cost/lb of payable copper produced is net of by-product credits and selling costs. AISC per pound of payable copper produced is C1 cash cost plus NSR and production royalties, non-cash deferred revenue, all sustaining capital expenditures (including cash portion of production-phase capitalized stripping), accretion of reclamation obligations, amortization of reclamation assets, corporate G&A and cash portion of pre-production capitalized stripping.
6
➢ PV3 mine plan more than doubles mine life, increases throughput and lowers operating costs without significant capital investment or operational changes ➢ Planning further 10% throughput expansion in 2020/2021, beyond below mine plan; timeline aligned to permitting
0.00% 0.10% 0.20% 0.30% 0.40% 0.50% 0.60% 0 M 10 M 20 M 30 M 40 M 50 M 60 M 2017 2018 2019 2020 2021 2022 2023 2024 2025 2026 2027 2028 2029 2030 2031 2032 2033 2034 2035 2036 2037 2038
Cu Grade Million Tonnes
PV2 Ore PV3 Ore PV2 Waste PV3 Waste Cu Grade - Pinto Valley Mine Plan
7
Source: Bing maps and boundaries are approximated
8
➢ Q2 Mala Noche Footwall Zone resource estimate doubled contained copper in M&I class ➢ Reserve update, ongoing drilling and materials handling study in 2018 ➢ Added zinc production significantly increases by-product credits
➢ Potential for expansion to use surplus mill capacity; only partially filled from zinc zone ➢ Additional infill drilling is targeting inferred resource for upgrading to M&I ➢ Additional exploration targets with potential to extend mine life
Cautionary Note for NI 43-101 information. 3. C1 cash cost/lb of payable copper produced is net of by-product credits and selling costs. AISC per pound of payable copper produced is C1 cash cost plus NSR and production royalties, non-cash deferred revenue, all sustaining capital expenditures (including cash portion of production-phase capitalized stripping), accretion of reclamation obligations, amortization of reclamation assets, corporate G&A and cash portion of pre-production capitalized stripping.
Mine life (years) 4+ 2018 Guidance Production1 (tonnes) C1 Cash Cost1,2,3 ($/payable lb produced) All-In Sustaining Cost1,2,3 ($/payable lb produced) 15,000 $0.75 - $0.85 $1.60 - $1.70 By-products Zn, Pb, Ag
9
100 150 200 250
Contained Cu (kt)
Dec 31, 2017* Mar 31, 2018**
110 kt 224 kt
* Refer to the Company’s 2017 Annual Information Form for detailed Mineral Resource Estimate information. **Refer to the Company’s NI 43-101 Technical Report on the Cozamin Mine dated July 19, 2018, effective March 31, 2018.
10
MNFWZ
San Rafael Zinc Zone San Rafael Shaft
Zinc Potential Open Cu-Zn Potential MNV
San Roberto Shaft
Looking North-Northeast
Zaragoza Shaft
2017/18 Targeting Indicated/Inferred
Endeavour Boundary 1 km 1600 2000 2400 MASL
➢ Mala Noche Vein (MNV) >5.5 km strike; open in both directions ➢ Mala Noche Footwall Zone (MNFWZ) >2 km strike; open to the southeast plus up and down dip ➢ Current mineral resource/reserve extends >2 km strike (MNV & MNFWZ) ➢ Surface and underground drilling targeting resource upgrades and testing new mineralized zones ▪ Focusing along strike plus up and down dip of resource models ▪ Also testing beneath historic mines and in additional splays off the MNV structure ➢ Copper exploration accelerated in 2018 to leverage recent successes in the MNFWZ on both sides of the Capstone/Endeavour Silver boundary (agreement in place)
11 11
➢ Announced divestiture to Pembridge Resources1 ➢ Proceeds to be directed to reducing net debt ➢ Transaction will allow Capstone to direct financial resources and management focus towards higher return assets
12 12
➢ Approved EIA and Port Concession ➢ Superior infrastructure at low elevation ➢ Ownership 70% Capstone; 30% Korea Resources
➢ Applications for long lead permits submitted
Long Lead Permits Receipt Mining Processing 2018/2019 Waste 2018/2019 Tailings 2018/2019
13 13
Updating Economics ➢ Feasibility Study update targeted for Q4 2018
conditions of lower power costs
eliminate Capstone port construction
Aligning ownership interest with financing capacity
14 14
At June 30, 2018 ($M) Long Term Debt $274.9 LESS: Cash, cash equivalents and short term investments $110.1 Net Debt $164.8 Total Net Debt/EBITDA 1.23:1
$99.0 $44.0 $24.0 $19.0 $12.0 Sustaining Development Total Pinto Valley Cozamin
3 2
1
➢ Revolving credit facility maturing 2021 ➢ Expected proceeds from Minto sale to further reduce net debt ➢ Net debt target of $100 million
(including capitalized stripping in development costs)
15 15
Source: BMO Capital Markets (July 2018 for Capstone, Copper Mountain, First Quantum, Hudbay, Taseko and Teck; April 2018 for Lundin) *Source: Bloomberg (July 19, 2018)
0.0x 2.0x 4.0x 6.0x 8.0x 10.0x
First Quantum Lundin* Taseko Teck Copper Mountain Hudbay Capstone
0% 10% 20% 30% 40% 50% 60%
Copper Mountain Capstone Taseko Hudbay First Quantum Lundin Teck
to 10% higher Cu Price
0% 5% 10% 15% 20% 25% 30%
Taseko Copper Mountain Capstone Lundin First Quantum Hudbay Teck
to 10% higher Cu Price
0% 10% 20% 30% 40%
Taseko Copper Mountain Capstone Lundin Hudbay First Quantum Teck
to 10% higher Cu Price
16
17 17
➢ Free cash flow and Minto proceeds used to reduce debt
➢ Pinto Valley plant optimization and regional opportunities ➢ Cozamin mine life extension and zinc upside ➢ Santo Domingo defining the value maximizing path forward
18 18
➢ Board of Directors ➢ Senior Management Team ➢ Financial & Operating Results ➢ Revolving Credit Facility ➢ 2018 Operating & Capital Guidance ➢ Santo Domingo July 2014 Feasibility Study Summary ➢ Consolidated Mineral Reserve Estimate ➢ Consolidated Mineral Resource Estimate ➢ Notes on Consolidated Mineral Reserve and Resource Estimates ➢ NI 43-101 Information
19 19
Name Experience George Brack - Non-Executive Chairman Mining and investment banking, former industry head of Scotia Capital and former President and CEO of Macquarie North America. Current Director of Wheaton Precious Metals, Alio Gold and Geologix. Bob Gallagher Former President & CEO of New Gold and Peak Gold and current Director of Yamana Gold, Southern Arc Minerals and Japan Gold; previously with Placer Dome and Newmont. Jill Gardiner Former Managing Director and Regional Head (BC) for RBC Capital Markets. Director of Capital Power and Parkbridge Lifestyle Communities. Former Chair of Turquoise Hill Resources and former Director of SilverBirch Hotels & Resorts and Timber Investments. Kalidas Madhavpeddi Advisor to China Molybdenum, former Senior VP Business Development of Phelps Dodge. Current Director of Trilogy Metals and Director and Chair of Compensation Committee of NovaGold Resources. Yong Jun Park Director & Secretary of KORES Canada Corporation. Dale Peniuk - Audit Committee Chairman Former Partner with KPMG. Director & Audit Committee Chair of Lundin Mining and Argonaut Gold. Darren Pylot - President, CEO & Director Founder of Capstone Mining. Richard Zimmer Former President & CEO of Far West Mining, previously with Teck and Bow Valley Industries. Current Chair of Ascot Resources and Director of Alexco Resources.
20 20
Name Experience Years Experience Years Mining Experience Darren Pylot, President, CEO & Director Founder of Capstone Mining 24 24 Jim Slattery, Senior VP & CFO Former CFO of Inmet Mining, Wescast Industries and Canadian General Tower 37 13 Gregg Bush, Senior VP & COO Former COO of Minefinders, Mine GM & Operations of Barrick/Placer Dome, 12 years in Chile 34 34 Brad Mercer, Senior VP Exploration Formerly with Sherwood Copper, Miramar Mining, Royal Oak and US Borax 34 34 Cindy Burnett, VP Investor Relations Formerly with Western Lithium, Skye Resources, Ivanhoe Energy and Nova Chemicals 39 10 Jason Howe, VP Corporate Development Co-founder & former CFO of Silverstone Resources; formerly with PricewaterhouseCoopers LLP 24 14 Wendy King, VP Legal, Risk & Governance Former Sr. VP General Counsel, Government Relations, Chief Compliance Officer and Corporate Secretary with Central 1 Credit Union and Weyerhaeuser Company 22 5 Gillian McCombie, VP Human Resources Formerly with Placer Dome, Hunter-Dickinson and TELUS 22 18 Raman Randhawa, VP Finance, Financial Planning & Analysis Former VP, Business Planning with Goldcorp Inc. 17 17
21 21
(2017 – $0.2 million) related to prior shipments, equivalent to $nil per pound (2017 – $nil per pound) of copper sold during the quarter. 2018 YTD includes a provisional pricing adjustment of $(2.2) million (2017 – $2.4 million) related to prior shipments, equivalent to $(0.03) per pound (2017 – $0.03 per pound) of copper sold during the six month period. 3. Q2 2018 adjusted realized copper price does not include any realized derivative losses (2017 loss - $7.7 million or $0.17 per pound) related to copper derivative contracts exercised during the quarter. 2018 YTD adjusted realized copper price does not include any realized derivative losses (2017 loss - $19.3 million or $0.21 per pound) related to copper derivative contracts exercised during the six month period. 4. In accordance with IFRS 5, Minto’s results are excluded from revenue but included within cash flow amounts in both the current and comparative period.
Q2 2018* Q2 2017 2018 YTD* 2017 YTD
Revenue from continuing operations (2),(3),(4) ($M) 101.5 88.0 205.2 185.9 Copper produced by continuing operations (tonnes) 16,940 19,597 32,646 35,027 Payable copper produced by continuing operations (tonnes) C1 cash cost per payable pound produced (1) ($/lb) All-in cost sustaining cost per payable pound produced (1) ($/lb) 16,336 1.84 2.55 18,914 1.70 2.07 31,488 1.90 2.57 33,804 1.81 2.25 Net income (loss) from continuing operations ($M) Net income (loss) from continuing operations attributable to shareholders ($M) Net income (loss) from continuing operations attributable to shareholders per common share - basic ($) 8.2 8.5 0.02 11.4 11.5 0.03 18.5 19.0 0.05 (1.7) (1.7) (0.00) Adjusted net income (loss) from continuing operations (1) ($M) Adjusted net income (loss) from continuing operations attributable to shareholders (1) ($M) Adjusted net income (loss) from continuing operations attributable to shareholders per common share - basic (1) ($) 8.3 8.6 0.02 (0.7) (0.6) 0.00 17.7 18.2 0.05 (8.8) (8.8) (0.02) Cash flow from operating activities (4) ($M) Cash flow from operating activities per common share - basic (1), (4) ($) Operating cash flow before changes in working capital (1), (4) ($M) Operating cash flow before changes in working capital per common share - basic (1), (4) ($) 28.8 0.07 30.7 0.08 4.1 0.01 26.0 0.07 61.6 0.16 55.3 0.14 26.1 0.07 50.1 0.13 Long term debt (excluding financing fees) ($M) 274.9 298.9 274.9 298.9 Net debt (1) ($M) 164.8 216.5 164.8 216.5
*See financial statements ending June 30, 2018 regarding accounting for Minto as a discontinued operation for financial reporting purposes in accordance with IFRS 5 Non- current assets held for sale and discontinued operations
22
Senior Secured Amount $325M credit facility Maturity April 19, 2021 Interest Rate: Until March 31, 2019 After March 31, 2019 US LIBOR+2.5% (Adjustable to 3.5% depending on total leverage ratio) US LIBOR+3.0% (Adjustable to 4.5% depending on total leverage ratio) Payment Schedule Interest only Facility Reduction Schedule Annual $25M reduction of the credit limit on each anniversary with credit limit reduced to $275M on April 19, 2020 Covenants1 EBITDA/Interest Expense ≥ 2.5:1 (June 30, 2018 actual was 8.91:1) Senior Secured Net Debt/EBITDA not more than 3.0:1 (June 30, 2018 actual was 1.23:1) Total Net Debt/EBITDA not more than 4.0:1 (June 30, 2018 actual was 1.23:1)
23 23
Production and Operating Costs Pinto Valley Cozamin Total
Copper Production (tonnes) 56,000 15,000 71,000 C1 Cash Cost1, 2 ($ per payable lb of Cu produced) $1.90 - $2.00 $0.75 - $0.85 $1.75 - $1.85 All-In Sustaining Cost3 ($ per payable lb of Cu produced) $2.50 - $2.60 $1.60 - $1.70 $2.50 - $2.60
Capital Expenditures (US$ millions) Pinto Valley Cozamin** Total
Sustaining $44 $19 $63 San Rafael Zinc Zone Development
3 Brownfield Exploration
9 Capitalized Stripping4 24
Total $68 $31 $99
Greenfield Exploration Expenditures**, 5 (US$ millions)
Total $3.7
credits and selling costs. 3. All-In sustaining cost per pound of payable copper produced is C1 cash cost plus NSR and production royalties, non-cash deferred revenue, all sustaining capital expenditures (including cash portion of production-phase capitalized stripping), accretion of reclamation obligations, amortization of reclamation assets, corporate G&A and cash portion of pre-production capitalized stripping. 4. Capitalized stripping is included as an operating cost in the PV3 PFS, however, under IFRS accounting guidelines stripping costs are capitalized when the strip ratio is higher than the life-of-mine strip ratio. 5. Greenfield exploration will be expensed.
*See financial statements ending June 30, 2018 regarding accounting for Minto as a discontinued operation for financial reporting purposes in accordance with IFRS 5 Non-current assets held for sale and discontinued operations. **See news release dated July 31, 2018 for updated exploration cost guidance.
24 24
accordance with IFRS 5 Non-current assets held for sale and discontinued operations.
Consolidated Total
(from continuing operations*)
Cozamin
Salaries Contractors & Consultants Maintenance Diesel, Gas & Lubricants Power Consumables Minesite G&A
Pinto Valley 27% 13% 22% 10% 9% 14% 5% 28% 31% 17% 4% 8% 7% 5% 27% 16% 21% 9% 9% 13% 5%
25 25
Summary of July 2014 FS1,2
Mine life (years) 18 Average annual production LOM Avg: 128M lbs Cu, 4.2 Mt Fe, 16 koz Au First 5 years: 248M lbs Cu, 3.3 Mt Fe, 35 koz Au
*Off-take agreements committed for 50% of Cu and Fe LOM
Planned throughput (tpd) LOM Avg: 60,500 First 5 Years: 65,000 Development capital $1.7B Investment return (after tax) IRR: 17.9%
(27.3% assuming $1B project debt or 60% leverage)
NPV @ 8% discount rate: $797M Payback: 4.2 years By-products Fe, Au
AMEC’s Santiago office with an accuracy range of -10% to +15% for capital and operating costs. The estimates presented in the FS are current as of October 2013.
Cautionary Note for NI 43-101 information.
Estimated C1 cash cost3
By-product Basis (Cu) LOM Average ($/payable lb Cu): First 5 years ($/payable lb Cu): ($0.06) $0.49 Co-product Basis (Cu & Fe) LOM Average ($/payable lb Cu): LOM Average ($/payable t Fe): $1.50 $43.00
Metal Price Assumptions
Cu: $2.85/lb Fe: $1.31/dmtu ($85/t conc. @ 65% Fe) Au: $1,275/oz
65% Estimated Project Debt KORES Equity
26
See corresponding Notes on Consolidated Mineral Reserve Estimate at the end of this presentation.
27
See corresponding Notes on Consolidated Mineral Resource Estimate at the end of this presentation.
28
NOTES: Mineral Reserves take into account mining activities (where applicable) until January 1, 2018. Pooya Mohseni, P.Eng., MBA, Director of Technical Services at Capstone, is the Qualified Person for the disclosure of Capstone's consolidated Mineral Reserves table. Rounding as required by reporting guidelines may result in apparent summation differences between tonnes, grade and contained metal content. All Mineral Reserve estimates are inclusive of dilution and mining recovery factors. Contained ounces (oz) are troy ounces. COG is cut-off grade. NSR is net smelter return. All amounts in US$ unless otherwise
information.
USD$2.50/lb per pound copper, USD$12.50/lb molybdenum. For the purposes of reporting mineral reserves going forward from January 1, 2017, an average cut-off grade of 0.175% Cu has been used, as it closely approximates the variable 0.17-0.18% Cu cut-off presented in the PV3 Pre-Feasibility NI 43-101 Technical Report. Proven mineral reserves include 400 kt of stockpiled material.
2017 was completed using fully diluted mineable stope shapes generated by the Maptek Vulcan Mine Stope Optimizer software and calculated estimated using on the 2016 MNFW and 2017 MNV resource block models created by J. Vincent, P.Geo., of Capstone Mining Corp. Mineral reserves are reported above a US$ 42/t NSR cut-off. The NSR formula used for the reserves uses the following metal prices: $2.50/lb Cu, $20.00/oz Ag, $1.00/lb Zn, MEX 18.5 to USD 1.0, and metallurgical recoveries of 94.5% Cu, 72% Ag, 70% Zn. The resulting NSR formula is $42.425*%Cu + 0.364*Agppm + 8.123*Zn%. Note that zero value is attributed to Pb because the circuit is expected to be used minimally due to low Pb concentrations. There are no mineral reserves declared in the Zinc Zone (San Rafael and San Roberto Zinc zones).
estimates for MSD underground deposits (Area 2/118 underground and Copper Keel underground) and Minto East underground have an effective date of December 31, 2016. The Area 2 open pit mineral reserves have an effective date of December 31, 2015. Metal Price assumptions used to calculate the COG for all deposits are: Cu=$2.50, Au=$300, Ag=$3.90. Processing recoveries for all deposits are: Cu=91%, Au=70%, Ag=78%. Open pit mineral reserves are reported above 0.5% Cu COG. Underground mineral reserves are reported above a 1.2% Cu COG. Calculation of mine depletion during 2017 was overseen by Kevin Cymbalisty, P.Eng., Mine Manager at Minto, and a Qualified Person as defined by NI 43-101.
for the preparation of the Mineral Reserves estimate with an effective date of May 2, 2014. Mineral Reserves are reported as constrained within Measured and Indicated pit designs, and supported by a mine plan featuring variable throughput rates and cut-off optimization. The pit designs and mine plan were optimized using the following economic and technical parameters: metal prices of $2.75/lb Cu, $1,275/oz Au and $80/dmt of Fe concentrate; recovery to concentrate assumptions of a maximum of 93.6% for Cu and 75% for Au, with magnetite concentrate recovery varying on a block-by-block basis; copper concentrate treatment charges of $70/dmt, $0.07/lb of Cu refining charges, $5/oz of Au refining charges, $48/wmt and $3/wmt for shipping Cu and Fe concentrates respectively; waste mining cost of $1.53/t, mining cost of $1.53/t ore, and process and G&A costs of $7.84/t processed; average pit slope angles that range from 37.6º to 43.6º; a 2% royalty rate assumption, and an assumption of 100% mining recovery. Fe metal in the table denotes magnetite. There have been no mining activities at Santo Domingo since the release of the NI 43-101 Technical Report.
29
NOTES: Mineral Resources take into account mining activities (where applicable) until January 1, 2018 for Minto Mine and Pinto Valley, and to March 31, 2018 for Cozamin Mine. Pooya Mohseni, P.Eng., MBA, Director of Technical Services at Capstone, is the Qualified Person responsible for the disclosure of Capstone's consolidated Mineral Resources table. Mineral Resources that are not Mineral Reserves do not have demonstrated economic viability. Mineral Resources are reported inclusive of the Mineral Reserves. All Mineral Resources are exclusive to dilution and mining recovery factors. Rounding as required by reporting guidelines may result in apparent summation differences between tonnes, grade and contained metal content. Contained ounces (oz) are troy ounces. COG is cut-off grade. NSR is net smelter return. M&I = Measured & Indicated. All amounts in US$ unless otherwise specified. Stockpiled material is treated as Measured Mineral Resources. See Technical Reports filed under Capstone’s profile on SEDAR for further information.
Cu cut-off. Measured Mineral Resources include 400 kt of stockpiled material.
formula: Cu*61.676+Ag*0.354+Zn*14.521+Pb*11.208. Metal price assumptions (in US$) used to calculate the NSR for all deposits are: Cu = $3.50/lb, Ag = $18.00/oz, Zn = $1.20/lb, and Pb = $1.00/lb. An exchange rate of MX$18.50 per US$1 is assumed. The following metal recoveries are used: 90% Cu, 74% Ag, 79% Zn, 76% Pb. Totals may not sum exactly due to rounding.
P.Geo., FGC, of Kirkham Geosystems Ltd., is an independent Qualified Person responsible for the preparation of the Mineral Resources estimates for the Minto North and Minto East 2 areas. The Minto East 2 area was re-estimated with an effective date of May 31, 2015. Jeremy Vincent, P.Geo., is the Qualified Person responsible for the Minto East resource estimate with an effective date of June 30, 2016. Dr. Wayne Barnett, Ph.D., P.Geo., of SRK Consulting (Canada) Inc., is an independent Qualified Person responsible for the preparation of the Mineral Resources estimate at Ridgetop that takes into account drill hole data until August 2010, and the MSD deposit, which includes the Area 2/118, Wildfire, and Copper Keel areas. The MSD Mineral Resource estimate has an effective date of May 31, 2015; the Copper Keel zone was updated in 2017. Ridgetop is amenable to open pit extraction. Area 2/118 and Wildfire areas are amenable to open pit and underground mining, while Minto East, Minto East 2, and Copper Keel areas are suitable for underground
preparation of the Mineral Resources estimates for the Santo Domingo Sur, Iris, and Iris Norte deposits, which have an effective date of August 31, 2012. Mineral Resource estimates for the Estrellita deposit have an effective date of October 30, 2007. Mineral Resources for the Santo Domingo Sur, Iris, and Iris Norte deposits are reported using a COG of 0.25% copper equivalent (CuEq). CuEq grades are calculated using average long term prices of US$3.50/lb Cu, US$1,500/oz Au and US$1.94/dmtu Fe (US$120/dmt conc. at 62% Fe). The CuEq equation is: Metal Value = Grade*Cm*R%/100*(Price-TCRC-Freight)*(100-Royalty)/100, where Cm is a constant to convert grade of metal to metal price units; R is metallurgical recovery and %Cu Equivalent = (Cu Value + Au Value + Fe Value)/(Cu Value per 1%Cu). An assessment of reasonable prospects for economic extraction for the Santo Domingo Sur, Iris, and Iris Norte deposits was performed using a Lerchs–Grossman pit shell that has the following assumptions: pit slopes averaging 45°; mining cost
by the pit shell. On the basis of this result, it was concluded that there was little merit in restricting the Mineral Resources to those blocks contained only within the pit shell. Fe in the table denotes magnetite. Accordingly, the Mineral Resource inventory was reported in its entirety. Mineral Resources for the Estrellita deposit are reported using a 0.3% Cu COG.
30 30
Unless otherwise indicated, Capstone has prepared the technical information in this presentation (“Technical Information”) based on information contained in the technical reports and news releases (collectively the “Disclosure Documents”) available under Capstone Mining Corp.’s company profile on SEDAR at www.sedar.com. Each Disclosure Document was prepared by or under the supervision of a qualified person (a “Qualified Person” or “QP”) as defined in National Instrument 43-101 – Standards of Disclosure for Mineral Projects of the Canadian Securities Administrators (“NI 43-101”). For readers to fully understand the information in this presentation, they should read the Technical Reports (available on www.sedar.com) in their entirety, including all qualifications, assumptions and exclusions that relate to the information set out in this presentation which qualifies the Technical Information. Readers are advised that mineral resources that are not mineral reserves do not have demonstrated economic viability. The Disclosure Documents are each intended to be read as a whole, and sections should not be read or relied upon out of context. The Technical Information is subject to the assumptions and qualifications contained in the Disclosure Documents. The technical information in this presentation has been prepared in accordance with Canadian regulatory requirements set out in National Instrument 43-101 Standards of Disclosure for Mineral Projects of the Canadian Securities Administrators ("NI 43-101") and reviewed and approved by Gregg Bush, P.Eng., Senior Vice President and Chief Operating Officer for Capstone Mining. Technical Information related to mineral exploration activities has been reviewed and approved by Brad Mercer, P. Geol., Senior Vice President, Exploration. Both are QP’s under NI 43-101. This presentation summarizes some of the information disclosed in the Pinto Valley Mine Life Extension – Phase 3 (PV3) Pre-Feasibility Study Technical Report dated February 23, 2016. The following QP’s authored the technical report: Gregg Bush, P.Eng of Capstone Mining Corp., Garth Kirkham, P.Geo. of Kirkham Geosystems Ltd., John Marek P.E. of Independent Mining Consultants, Inc., Ken Major, P.Eng. of KWM Consulting Inc., Tony Freiman, P.E. of Amec Foster Wheeler Environment & Infrastructure Inc. and Cori Hoag C.P.G. of SRK Consulting (U.S.), Inc. This presentation summarizes some of the information contained in the NI 43-101 Technical Report on the Cozamin Mine, Zacatecas, Mexico dated July 31, 2014. The following QP’s were responsible for the preparation of their relevant portions of the Technical Report: Patrick Andrieux, PhD., P.Eng. (Itasca Consulting Group. Inc), Dave Hallman, PE (Tetra Tech, Inc), Jenna Hardy, P.Geo. (Nimbus Management Ltd.), Mel Lawson, SME-RM (Stantec Consulting International LLC), Ken Major, P.Eng. (KWM Consulting Inc.), Vivienne McLennan, P.Geo. (Capstone Mining Corp.), Allan Schappert, SME-RM (Stantec Consulting International LLC), Ali Shahkar, P.Eng. (Lions Gate Geological Consulting Inc.), Robert Sim, P.Geo. (Sim Geological Inc.), Brad Skeeles, P.Eng. (formerly with Capstone Mining Corp.), and Jeremy Vincent, P.Geo. (Capstone Mining Corp.). This presentation summarizes some of the information contained in the NI 43-101 Technical Report on the Cozamin Mine, Zacatecas, Mexico dated July 19, 2018. The following QP’s were responsible for the preparation of their relevant portions of the Technical Report: Gregg Bush, P.Eng of Capstone Mining Corp., Jenna Hardy, P.Geo. (Nimbus Management Ltd.), Garth Kirkham, P.Geo. of Kirkham Geosystems Ltd., Chris Martin, Ceng MIMMM, Blue Coast Group Ltd., Vivienne McLennan, P.Geo. (Capstone Mining Corp.), Pooya Mohseni, MBA, MASc., P.Eng. of Capstone Mining Corp., and Humberto Preciado, PhD, P.E. of Wood Environment & Infrastructure Solutions, Inc. This presentation summarizes some of the information contained in the Minto Phase VI Preliminary Feasibility Study Technical Report dated July 31, 2012. Qualified Persons under National Instrument 43-101 responsible for this report: John Sagman, BASc., P.Eng., PMP, Wayne Barnett, Pr.Sci.Nat., SRK Consulting (Canada), Inc., John Eggert, P.Eng, Eggert Engineering Ltd; Bruce Murphy, P.Eng., SRK Consulting (Canada), Inc.; Bill Hodgson, P.Eng., Genivar Inc.; Garth Kirkham, P. Geo, Kirkham Geosystems Ltd; Michael Levy, PE, SRK Consulting (Canada), Inc.; Brad Mercer, P.Geol. Capstone Mining Corp.; Pooya Mohseni, P.Eng., Minto Exploration; Marek Nowak, P.Eng., SRK Consulting (Canada) Inc.; and Colleen Roche, P.Eng., Capstone Mining Corp. who are responsible for certain sections of the PFS as detailed in the PFS. This presentation summarizes some of the information contained in the Santo Domingo Project; Region III, Chile; NI 43-101 Technical Report on Feasibility Study dated July 8, 2014, 100% basis. The following QP’s were responsible for the preparation of their relevant portions of the Technical Report based on the Feasibility Study: David Frost, F.AusIMM (AMEC Ingeniería y Construcción Ltda.), Hans Gopfert, P.Eng (AMEC Ingeniería y Construcción Ltda.), Joyce Maycock, P. Eng (AMEC Ingeniería y Construcción Ltda.), Vikram Khera, P. Eng (AMEC Ingeniería y Construcción Ltda.), Anna Klimek, P.Eng (AMEC Ingeniería y Construcción Ltda.), Roy Betinol, P.Eng. (BRASS Chile S.A.) -- Seawater and Magnetite Concentrate Pipeline System, Carlos Guzmán, F.AusIMM (NCL Ingeniería y Construcción Ltda.) -- Mineral Reserve Model, Mine Equipment and Mine Development , Tom Kerr, P.Eng. (Knight Piésold S. A.) - Tailings Storage Facility, David Rennie, P. Eng (Roscoe Postle Associates Inc.) -- Mineral Resource Model. The technical information in the July 8, 2014 report was reviewed by Court Muggli, P.E., formerly Project Director, Capstone Mining Corp., and Gregg Bush, P. Eng., Senior Vice President and Chief Operating Officer, Capstone Mining Corp., both QP’s under NI 43-101.
31
Updated July 31, 2018