
SLIDE 1
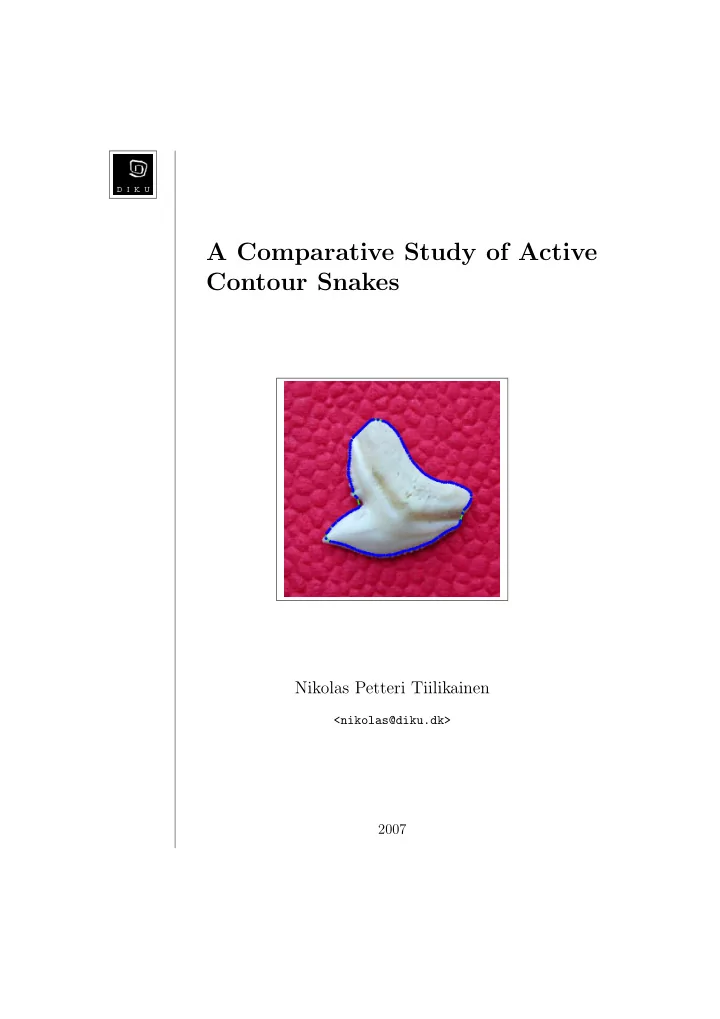
A Comparative Study of Active Contour Snakes
Nikolas Petteri Tiilikainen
<nikolas@diku.dk>
2007
A Comparative Study of Active Contour Snakes Nikolas Petteri - - PDF document
A Comparative Study of Active Contour Snakes Nikolas Petteri Tiilikainen <nikolas@diku.dk> 2007 Contents 1 Introduction 3 1.1 Problem Description and Goals . . . . . . . . . . . . . . . . . 4 1.2 The Enclosed CD . . . . . . . . .
<nikolas@diku.dk>
2007
1 Introduction 3 1.1 Problem Description and Goals . . . . . . . . . . . . . . . . . 4 1.2 The Enclosed CD . . . . . . . . . . . . . . . . . . . . . . . . . 4 1.3 Organization of the Report . . . . . . . . . . . . . . . . . . . 5 2 Literature Review 6 2.1 The Original Snake by Kass, Witkin & Terzopoulos . . . . . . 7 2.2 An Active Contour Balloon Model . . . . . . . . . . . . . . . 8 2.3 The Greedy Snake Algorithm . . . . . . . . . . . . . . . . . . 9 2.4 The Gradient Vector Flow Snake . . . . . . . . . . . . . . . . 9 3 Analysis of the Kass et al. & Greedy snake 11 3.1 The Kass et al. snake model explained in detail . . . . . . . . 12 3.1.1 The image energy forces Eimg(v(s)) . . . . . . . . . . 12 3.1.2 The internal energy of the snake Eint(v(s)) . . . . . . 14 3.1.3 Minimizing the energy functional of the snake . . . . . 15 3.1.4 Discrete approximation . . . . . . . . . . . . . . . . . 18 3.2 The Greedy snake model explained in detail . . . . . . . . . . 21 3.2.1 Evaluating the image energy . . . . . . . . . . . . . . 21 3.2.2 The elasticity term of the greedy snake . . . . . . . . 22 3.2.3 The curvature term of the greedy snake . . . . . . . . 23 3.2.4 The algorithm . . . . . . . . . . . . . . . . . . . . . . 24 3.3 Extensions and improvements . . . . . . . . . . . . . . . . . . 26 3.3.1 Scale space continuation . . . . . . . . . . . . . . . . . 26 3.3.2 Stopping criterion for the Kass et al. snake . . . . . . 27 3.3.3 Active resampling of the Kass et al. snake curve . . . 28 3.3.4 Randomizing snake points for the greedy algorithm . . 31 4 User Guide and Implementation Details 32 5 Experimental Results 34 5.1 Test number 1; Boundary concavity . . . . . . . . . . . . . . 34 5.2 Test number 2; Noisy image . . . . . . . . . . . . . . . . . . . 37 5.3 Test number 3; Image of a leaf . . . . . . . . . . . . . . . . . 41 1
5.4 Test number 4; The shark tooth . . . . . . . . . . . . . . . . . 43 5.5 Comparing computational speed . . . . . . . . . . . . . . . . 45 5.6 Discussion of results . . . . . . . . . . . . . . . . . . . . . . . 46 6 Conclusion 47 6.1 Future extensions . . . . . . . . . . . . . . . . . . . . . . . . . 47 6.2 Summary . . . . . . . . . . . . . . . . . . . . . . . . . . . . . 48 A Source code 49 A.1 main.m . . . . . . . . . . . . . . . . . . . . . . . . . . . . . . 49 A.2 KassSnake.m . . . . . . . . . . . . . . . . . . . . . . . . . . . 54 A.3 GreedySnake.m . . . . . . . . . . . . . . . . . . . . . . . . . . 57 A.4 snakeResample.m . . . . . . . . . . . . . . . . . . . . . . . . . 61 A.5 getImgEnrg.m . . . . . . . . . . . . . . . . . . . . . . . . . . . 62 A.6 getAvgDist.m . . . . . . . . . . . . . . . . . . . . . . . . . . . 63 A.7 getModulo.m . . . . . . . . . . . . . . . . . . . . . . . . . . . 64 Bibliography 66 2
Chapter
This report is written by Nikolas Petteri Tiilikainen as part of a graduate level project at the computer science department of Copenhagen University, (DIKU). The subject of interest is Active Contours, also know as Snakes1. Snakes are mainly used to dynamically locate the contour of an object. This subject belongs to the image processing research field and it is therefore rec-
algebra and calculus. The project is valued at 7.5 ECTS which equals 1/8
implementations and the experiments since it is well suited for the kind of computations that will be required, and is widely used in the image process- ing community. I would like to thank my project supervisor Professor Peter Johansen for agreeing to supervise this project, even though I was studying abroad at Utrecht university for a large part of the project period. Keywords: Active contour, snake, parametric curve, finite differences, greedy algorithm, energy minimization, segmentation, calculus of variations.
1The two terms “active contour” and “snake” will be used interchangeably hereafter.
3
The main goal of this project is to compare two different methods within the active contour framework. In order to successfully achieve this goal the following questions will be answered.
method? In order to answer question 1 and 2 a brief review of the main research papers dealing with active contours will be given, followed up by a detailed analysis
gorithm by Williams and Shah [Williams-92]. The reason for choosing these two algorithms for a closer comparisons is that the Kass et al. paper was the first paper to suggest energy minimizing snakes for image segmentation. The greedy snake algorithm on the other hand is interesting to examine since it deals with discrete values when minimizing the snakes energy. Most
two algorithms. To answer question number 3 both the Kass et al. snake and the greedy snake will be implemented in MATLAB. By running a number of experiments, with the two implemented snakes, both on synthetic and real images questions 4 and 5 will be sought answered. Finally the strengths and weaknesses of each of the two snake algorithms will be discussed, and if possible suggestions for improvements will be given. In the process of writing this report and implementing the algorithms I also hope to acquire a deeper understanding of active contours, since this is an area of much interest to me. It should also be noted that to limit the scope of this project we will
as in [Caselles-97].
At the back of this report a CD-rom has been attached. The CD contains all the relevant images and MATLAB source code required to duplicate the 4
experiments shown in chapter 5. Furthermore the CD also contains this report in pdf format and the images that were attained when running the
tiilikainen.dk/snakesCD.zip if desired.
Figure 1.1: The directory structure of the enclosed CD.
The remainder of the report is organized as follows. In the next chapter a literature review, of a selection of papers dealing with active contours, is given. Thereafter the theoretical aspects of both the Kass et al. snake and the greedy snake will be analyzed and explained in detail. This will be followed up by a chapter containing the results that were obtained when running the two snake algorithms on the test images, together with a discus- sion of the results. The final chapter will be the conclusion. In the appendix the reader will find the MATLAB source code for the two snakes and the list of references. 5
Chapter
This chapter will start with a general introduction of what an active contour is used for and how it works. Hereafter a brief literature review will be presented which highlights the main differences for some of the most widely known active contour methods. Active contours are used in the domain of image processing to locate the contour of an object. Trying to locate an object contour purely by running a low level image processing task such as Canny edge detection is not particularly successful. Often the edge is not continuos, i.e. there might be holes along the edge, and spurious edges can be present because of noise. Active contours tries to improve on this by imposing desirable properties such as continuity and smoothness to the contour of the object. This means that the active contour approach adds a certain degree of prior knowledge for dealing with the problem of finding the object contour. An active contour is modeled as parametric curve, this curve aims to minimize its internal energy by moving into a local minimum. The position
s ∈ [0, 1]1, in practice the curve is often closed which means that v(0) = v(1). Furthermore the curve is assumed to be parameterized by arc length. A closed parametric snake curve is illustrated in figure 2.1. Each point along the curve is under the influence of both internal end external forces, and the snake continuously tries to position itself so that the combined energy of these forces is minimized.
1The interval is defined as [a, b] = {x|a ≤ x ≤ b}.
6
Figure 2.1: Illustration of a parametric snake curve v(s). The blue dot marks the starting point and end point of the snake curve. Ideally the snake will have minimized its energy when it has positioned itself on the contour of the object.
The concept of active contours was introduced by Kass, Witkin and Ter- zopoulos in the seminal paper “Snakes: Active Contour Models” [Kass-88]. The paper was very influential and sparked much research. As we have already seen a snake is a parametric curve which tries to move into a position where its energy is minimized. Kass et al. introduced the following energy functional for calculating the snake energy E∗
snake =
1 Esnake(v(s))ds = 1 Eint(v(s)) + Eext(v(s))ds = 1 Eint(v(s)) + Eimg(v(s)) + Econ(v(s))ds. (2.1) The snake energy consist of three terms. The first term Eint represents the internal energy of the snake while the second term Eimg denotes the image forces, the last term Econ gives rise to external constraint forces. The sum of the image forces Eimg and the external constraint forces Econ is also simply known as the external snake forces, denoted by Eext. The internal energy of the snake is written as Eint = 1 2
(2.2) 7
where the first-order term vs(s)2 gives a measure of the elasticity, while the second-order term vss(s)2 gives a measure of the curvature. This means that in parts of the snake where the curve is stretched, the elasticity term will have a high value, while in parts of the snake where the curve is kinked, the curvature term will have a high value. The influence that these terms have on the overall snake energy is controlled by the coefficients α(s) and β(s), lovering these two parameters makes the snake more elastic and less rigid, i.e. more deformable. The image forces Eimg attracts the snake to the desired features in the
energy can be defined as Eimg = −∇I(x, y)2, with I being the image
gradient values. The external constraint forces Econ are attributed to some form of high level image understanding, most likely defined by human interaction. In [Kass-88] the external constraint forces are manipulated by letting the user insert a volcano icon which pushes the snake away. This is useful for pushing the snake out of a undesired local minimum. In the appendix of [Kass-88], Kass, Witkin and Terzopoulos goes on to show that the energy functionals are minimized by the solution of two independent Euler equations. If the Euler equations are approximated by finite differences the solution can be found by solving the following two matrix equations Ax + fx(x, y) = 0 (2.3) Ay + fy(x, y) = 0. (2.4) Here A is a pentadiagonal banded matrix consisting of the α(s) and β(s) values, x and y are the new snake coordinates that we seek, while the last term in each of the two equations is defined as fx(x, y) = ∂Eext ∂x , fy(x, y) = ∂Eext ∂y . (2.5) A more detailed analysis of the Kass et al. snake and its solution is given in chapter 3.
The active contour model that Kass et al. introduced was further developed by Laurent D. Cohen in the paper“On Active Contour Models and Balloons” [Cohen-91]. The snake model that Cohen presents in the paper works on the same principles as the Kass et al. snake, but where the Kass et al. snake would shrink when not under the influence of image forces the Cohen snake
8
being inflated in 2D, which is why this snake model is usually called the balloon snake. The expansive behavior is achieved by altering the values of fx(x, y) and fy(x, y) in equation 2.5 so that they instead are defined as fx(x, y) = k1n(s) − k ∇Px ∇Px, fy(x, y) = k1n(s) − k ∇Py ∇Py. (2.6) where n(s) is the unit principal normal vector to the curve at point v(s) and k1 is the amplitude of this force. The unit principal normal vector is perpendicular to the tangent at the current point, which means that the sign of k1 can be set so that all of the k1n(s) vectors are pointing outwards resulting in the snake curve being expanded. We have ∇Px = ∂Eext/∂x and ∇Py = ∂Eext/∂y while the magnitude of k determines the influence of the normalized external forces. Thus the equations in 2.6 also show another
normalization of the external snake forces. The changes to the original Kass et al. snake that the balloon snake introduces makes it possible to find the contours of an object by placing the initial snake inside the object instead of outside, while also providing more stable results [Cohen-91].
The greedy snake algorithm was introduced by Williams and Shah [Williams-92], their approach differs from the original Kass et al. snake and the balloon snake by computing the movement of the snake points in a fully discrete
vidually on the discrete indices of the image, as opposed to computing the iteration of the whole snake at once as with the Kass et al. algorithm. The movement of each snake point is computed by looking at the neighborhood
sition in the neighborhood which minimizes the the energy term. The name
their new positions. Furthermore Williams and Shah [Williams-92] also investigate efficient ways to approximate the curvature term vss(s)2 when dealing with dis- crete curves. This leads to a new way of computing the curvature term, which is particularly appropriate for the greedy snake algorithm.
One of the more recent snake models that have been developed is the gra- dient vector flow snake by Xu and Prince [Xu-98]. The gradient vector flow snake was developed in order to increase the capture range and improve the 9
snakes ability to move into boundary concavities. The capture range of the
thermore the original snake has problems with moving into concave regions e.g. moving into the concave region of an U-shaped object. The gradient vector flow snake handles these problems by introduc- ing a new external force. This new external force is a dense vector field derived from the image by minimizing an energy functional in a varia- tional framework. Xu and Prince denominate these fields as gradient vec- tor flow fields. The gradient vector flow field is defined as the vector field v(x, y) = (u(x, y), v(x, y)) that minimizes the following energy functional ε = µ(u2
x + u2 y + v2 x + v2 y) + ∇f2v − ∇f2dxdy.
(2.7) Where f is gray level or binary edge map which can be obtained by means
The parameter µ regularizes the effect of the first term in the integrand, which is a smoothing term derived from the formulation of optical flow [Xu-98]. If the original image contains large amounts of noise µ should be increased in order to compensate. When ∇f is small the energy of ε is dominated by the first term in the integrand which yields a slowly varying field. While if ∇f is large, the second term dominates the energy functional and will be minimized by setting v = ∇f. This leads to the vector field v being slowly varying in homogeneous regions, and at the same time being nearly equal to the gradient of the edge map in regions where the gradient of the edge map is large. 10
Chapter
In the previous chapter a short introduction to what an active contour is and how it works was presented, followed up by a review of some of the best know parametric active contour models. In this chapter we will continue with a more thorough analysis of the Kass et al. and the greedy snake algorithm. Thereafter possible extensions and improvements to the two snake algorithms will be examined. However, let us first take a look at the parametric curve and examine why it is used as the basis for the snake model. The most basic way of representing a curve in two dimensions is the explicit form y = f(x). (3.1) Nearly all simple curves can be represented using the explicit form, but for more complex curves with two or more y-values for a single corresponding x-value the explicit form fails. Moreover the explicit form has problems with modeling curves parallel to the y-axis, since the slope for such a curve tends towards infinity. These shortcomings excludes the use of the explicit form for curves such as circles, ellipses and other conics. The two dimensional implicit curve equation f(x, y) = 0 (3.2) can be used to represent any curve, thus avoiding the limitations of the ex- plicit curve. Unfortunately the inherent form of the implicit curve equation does not allow us to compute points on the curve directly, often requiring the solution of a non-linear equation for each point. Furthermore both the explicit and implicit form requires that the underlying function is know, and in practice when dealing with complex deforming curves such as snakes this is not the case. This leads us to consider the parametric form of a curve which, in vector form, is specified as v(s) = x(s) y(s)
(3.3) 11
The parametric curve only has one independent parameter s which is varied
we avoid the problems that both the explicit and implicit forms have. For instance we can have multiple y-values for a single x-value, this is easy to see in the parametric form of a unit circle with centre at origin v(s) = x(s) y(s)
cos s sin s
s ∈ [0, 2π]. (3.4) Finally using the parametric representation also enables the curve to be independent of the particular coordinate system used. A more in depth study of parametric curves can be found in [Salomon-06]
The Kass et al. snake model will first be examined in the continuous do- main, thereafter it will be shown how the continuous snake model can be transformed into a discrete model for implementation. In chapter 2 some of the key concepts of the snake model were briefly introduced and we also presented the energy functional of the snake E∗
snake =
1 Eint(v(s)) + Eext(v(s))ds. (3.5) The external energy Eext(v(s)) consists of both the image energy Eimg(v(s)) and the external constraint forces Econ(v(s)), however in order to simplify the analysis we will disregard the external constraint forces for now, so we get E∗
snake =
1 Eint(v(s)) + Eimg(v(s))ds. (3.6) In the subsequent sections we will show how the total energy of the snake depends on both the nature of the image energy, the shape of the snake curve and its parameterization.
3.1.1 The image energy forces Eimg(v(s))
Let us take closer look at the image energy Eimg(v(s)). A crucial step in the snake model is finding a suitable term for the image energy, this is because the snake will try to position itself in areas of low energy. Often the snake should be attracted to edges in the image and when this is the case a suitable energy term is Eimg = −∇I(x, y)2, where I is the image function. In order to remove noise from the image and increase the capture range of the snake 12
the image can be convolved with a Gaussian kernel before computing the
Eimg = −∇[Gσ(x, y) ∗ I(x, y)]2 (3.7) where Gσ(x, y) is a two dimensional Gaussian with standard deviation σ. When strong edges in the image are blurred by the Gaussian the the corre- sponding gradient is also smoothed which results in the snake coming under the influence of the gradient forces from a greater distance, hereby increas- ing the capture range of the snake. In figure 3.1 the concept of the image energy is illustrated.
Figure 3.1: Illustration of the image energy. (a) The original image I(x, y), showing a black square on a white background. (b) The image energy derived from the function −∇[Gσ(x, y) ∗ I(x, y)]2, with σ = 9, shown as a 3D surface. (c) The same image energy as seen in (b) shown as an image, dark shades represent negative values while white is zero.
Figure 3.1 also exemplifies how the capture range is increased when first applying Gaussian convolution to the image, since the image energy would be focused only in the direct vicinity of the black square in 3.1(a) if the energy term −∇I(x, y)2 had been used. When the snake is placed near the black square in 3.1(a) it will try to minimize its energy by slithering down the slope of the 3D surface in 3.1(b). Once the snake reaches the bottom of the valley it will settle as the energy will have reached a minimum, usually this is a local minimum but in this particular case it is actually a global minimum. The position which the snake settles in will correspond to the contour of the black square, since that is the location of the maximum gradient magnitude. In addition to the two image energy terms introduced here, many others have been suggested. Kass et al. also suggests using the intensity of the image [Kass-88], while as we have seen in section 2.4 the gradient vector flow snake utilizes its own novel image energy term [Xu-98]. 13
3.1.2 The internal energy of the snake Eint(v(s))
In addition to the forces given by the image energy the snake is also under the influence of its own internal energy. The internal energy of the snake is defined as Eint = 1 2
. (3.8) As stated previously in section 2.1 the first order term vs(s)2 measures the elasticity of the snake, while the second order term vss(s)2 measures the curvature energy. The influence of each term is controlled by the coefficients α(s) and β(s). The more the snake is stretched at a point v(s) the greater the magnitude of the first order term, whereas the magnitude of the second
It should be noted that if the snake is not under the influence of any image energy, and only moves to minimize its own internal energy. Then, for a closed curve, it will take the form of a circle that keeps shrinking and for a open curve the snake will position itself to form a straight line thats also
preserve desirable properties such as continuity and smoothness of the curve.
Figure 3.2: Illustration of a parametric curve v and some of the intrinsic vectors associated with the curve at the point v(s). The green vector is the tangent vector, the red vector is the unit principal normal vector and the blue vector shows the curvature multiplied with the unit principal normal vector.
The first term in the internal energy of the snake is defined as the mag- nitude of the first derivative of the parametric curve. The first derivative of a parametric curve is give by vs(s) = xs(s) ys(s)
(3.9) This derivative is the tangent vector to the curve at any point, and the direction of the tangent vector is the direction that the curve has at the point, see figure 3.2. The magnitude/lenght of the tangent vector states the speed of the curve at the point. The speed of a parametric curve indicates the distance covered on the curve when s is incremented in equal steps [Salomon-06]. Therefore when the internal energy of the snake is being minimized, the speed of the curve will be diminished in places where the 14
speed is high. This means that the elasticity force helps keep the curve from deforming excessively. The elasticity force also has the effect of making the curve shrink, even when it is not deformed. Thus the shrinking effect allows us to place the snake around the the object we wish to find the contour of, and then be fairly certain that it will come in contact with the image energy
in order to prevent the elasticity force from overcoming the image energy completely, as this would result in the snake disregarding the image energy and shrinking into a single point. The magnitude of the second derivative of the parametric curve vss(s) is used to measure how much the snake curves at a point. Usually the curvature k of a parametric curve is given by the second derivative of the curve with regards to the arc length l vll(s) = kN (3.10) where N is the unit principal normal vector [Salomon-06]. The unit principal normal vector is illustrated in figure 3.2. The magnitude of the curvature equals vll(s) = kN = |k|N = |k|1 = |k|. (3.11) From equation 3.10 we see that Kass et al. assumes that the snake curve is parameterized by arc length, so vll(s) = vss(s) otherwise the term vss(s) does not measure curvature. A curve v from [a, b] is said to be parameterized by arc length s if vs(s) = 1 for all s ∈ [a, b], i.e. when the curve parameter s is incremented by 1 the curve length also increases by 1. Clearly this assumption does not always hold for all snake curves. Although in practice the snake does seem to perform reasonably well when using vss(s) for measuring the curvature, as we will see later in the experimental results
that controls the influence of the curvature energy. The snake should be able to bend somewhat in places with high image energy while keeping straight in places with low image energy.
3.1.3 Minimizing the energy functional of the snake
So far we have examined the energies involved in the functional of the snake and how these forces influence the snake. Now we will take a closer look at how to find the minimum of the snake functional E∗
snake =
1 1 2
+ Eimg(v(s))ds. (3.12) Until now we have used the word functional without giving a formal
where a normal function is defined on a subset of real numbers a functional 15
is defined on a subset of the set of all functions. To minimize a functional we have to employ the somewhat complex technique of ”calculus of variations“ [Sagan-69]. In the following it will be shown how the energy functional of the snake can be minimized using calculus of variations, see also chapter 6 in [Nixon-02]. We will consider a valid solution ˆ v(s) perturbed by a small amount εδv(s), for which the functional derivative is at a stationary point dEsnake(ˆ v(s) + εδv(s)) dε = 0, (3.13) where ε is a small arbitrary scalar and δv(s) = [δx(s), δy(s)]T is an arbitrary function of s. Of course being at a stationary point we might select a max- imum instead of a minimum, but in practice this is not a problem since the snake will generally not be able to settle on a maximum as it moves over the image energy surface. The perturbation affects the x and y coordinates
ˆ v(s) + εδv(s) = [ˆ x(s) + εδx(s), ˆ y(s) + εδy(s)]T . (3.14) The perturbed snake solution is substituted into the snake functional 3.12 which gives Esnake(ˆ v(s) + εδv(s)) = 1
2α(s)
v(s) + εδv(s)) ds
+ 1 2β(s)
v(s) + εδv(s)) ds2
+ Eimg(ˆ v(s) + εδv(s))
(3.15) By substituting with 3.14 and expanding the squared magnitude terms we get Esnake(ˆ v(s) + εδv(s)) = 1
2α(s) dˆ x(s) ds 2 + 2εdˆ x(s) ds dδx(s) ds +
ds 2 + dˆ y(s) ds 2 + 2εdˆ y(s) ds dδy(s) ds +
ds 2 + 1 2β(s) d2ˆ x(s) ds2 2 + 2εd2ˆ x(s) ds2 d2δx(s) ds2 +
ds2 2 + d2ˆ y(s) ds2 2 + 2εd2ˆ y(s) ds2 d2δy(s) ds2 +
ds2 2 + Eimg(ˆ v(s) + εδv(s))
(3.16) 16
The Taylor series expansion of the image energy term equals Eimg(ˆ v(s) + εδv(s))} = Eimg(ˆ x(s) + εδx(s), ˆ y(s) + εδy(s)) = Eimg(ˆ x(s), ˆ y(s)) + εδx(s)∂Eimg ∂x
x,ˆ y
+ εδy(s)∂Eimg ∂y
x,ˆ y
+ O(ε2) (3.17) where ∂Eimg
∂x
x,ˆ y
denotes the partial derivative of the image energy with re- gards to x at the points (ˆ x, ˆ y). The higher order terms O(ε2) can be ignored since ε is small. Substituting the results from 3.17 into equation 3.16 enables us to write equation 3.16 as Esnake(ˆ v(s) + εδv(s)) = Esnake(ˆ v(s)) + ε 1 α(s)dˆ x(s) ds dδx(s) ds + β(s)d2ˆ x(s) ds2 d2δx(s) ds2 + δx(s)∂Eimg ∂x
x,ˆ y
ds + ε 1 α(s)dˆ y(s) ds dδy(s) ds + β(s)d2ˆ y(s) ds2 d2δy(s) ds2 + δy(s)∂Eimg ∂y
x,ˆ y
ds. (3.18) The perturbed solution is at a minimum therefore the two integration terms in 3.18 must be equal to zero 1 α(s)dˆ x(s) ds dδx(s) ds + β(s)d2ˆ x(s) ds2 d2δx(s) ds2 + δx(s)∂Eimg ∂x
x,ˆ y
ds = 0, (3.19) 1 α(s)dˆ y(s) ds dδy(s) ds + β(s)d2ˆ y(s) ds2 d2δy(s) ds2 + δy(s)∂Eimg ∂y
x,ˆ y
ds = 0. (3.20) We now integrate equation 3.19 applying the ”integration by parts“ rule to
x(s) ds δx(s) 1 − 1 d ds
x(s) ds
+
x(s) ds2 dδx(s) ds 1 − d ds
x(s) ds2
1 + 1 d2 ds2
x(s) ds2
1 ∂Eimg ∂x
x,ˆ y
δx(s)ds = 0. (3.21) The first, third and fourth term all equal zero since we are dealing with a closed contour where δx(1) − δx(0) = 0 and δy(1) − δy(0) = 0, so equation 3.21 reduces to 1
ds
x(s) ds
ds2
x(s) ds2
∂x
x,ˆ y
(3.22) 17
Since equation 3.22 must hold for an arbitrary choice of δx(s) it follows that the functional derivative must vanish. This is also known as the fundamental lemma of the calculus of variations [Sagan-69]. Thus we end up with the following differential equation known as the Euler-Lagrange equation − d ds
x(s) ds
ds2
x(s) ds2
∂x
x,ˆ y
= 0. (3.23) By similar development of equation 3.20 we get − d ds
y(s) ds
ds2
y(s) ds2
∂y
x,ˆ y
= 0. (3.24) The minimum of the snake energy functional can now be found by solv- ing these two independent Euler-Lagrange equations. However to solve the two equations numerically we have to provide a discrete formulation of the equations, the next section will be devoted to this.
3.1.4 Discrete approximation
The closed snake curve v(s) where s is continuous in the interval [0, 1] will be discretised into a curve consisting of a set of control points v(si) with i = {1, 2, ..., N}, and v(s1) = v(sN) . If it is assumed that each control point along the curve is equally spaced by a small distance denoted h, then the derivatives in the Euler-Lagrange equation can be approximated by the following finite differences dx(si) ds ≈ x(si) − x(si−1) h , d2x(si) ds2 ≈ x(si+1) − 2x(si) + x(si−1) h2 . (3.25) Where the term to the left of the comma in equation 3.25 is the backward difference formula and the term to the right of the comma is the central dif- ference formula. Finite elements can also be used instead of finite differences [Cohen-93], but finite differences have been chosen here as they are simpler to implement. By substituting the derivatives in the Euler-Lagrange equation 3.23 with the finite difference approximations we obtain the subsequent solution for the x coordinate at the snake point si − 1 h
h − α(si)(x(si) − x(si−1)) h
h2
h2 − 2β(si)(x(si+1) − 2x(si) + x(si−1)) h2 + β(si−1)(x(si) − 2x(si−1) + x(si−2)) h2
∂x
= 0. (3.26) 18
The above equation can be reformulated so each snake point is coupled with its own coefficient β(si−1) h4
h4 − α(si) h2
+ β(si+1) + 4β(si) + β(si−1) h4 + α(si+1) + α(si) h2
+
h4 − α(si+1) h2
β(si+1) h4
∂x
. (3.27) The snake forms a closed contour which means that we have the following cyclic boundary conditions for the snake control points, x(s1−2) = x(sN−2), x(s1−1) = x(sN−1), x(s1) = x(sN), x(s1+1) = x(sN+1), x(s1+2) = x(sN+2), α(s1+1) = α(sN+1), α(s1) = α(sN), β(s1+1) = β(sN+1), β(s1−1) = β(sN−1) and β(s1) = β(sN). From these boundary conditions we see that equation 3.27 holds for all si values, this enables us to write 3.27 in a more convenient matrix form. Let us denote the coefficients with a(si) = β(si−1) h4
b(si) =
h4 − α(si) h2
c(si) = β(si+1) + 4β(si) + β(si−1) h4 + α(si+1) + α(si) h2
d(si) =
h4 − α(si+1) h2
e(si) = β(si+1) h4
fx(i)(x, y) =
∂x
(3.28) The complete solution to equation 3.27 is then given by the matrix system
c(s1) d(s1) e(s1) · · · a(s1) b(s1) b(s2) c(s2) d(s2) e(s2) · · · a(s2) a(s3) b(s3) c(s3) d(s3) e(s3) · · · ... ... ... ... ... ... . . . e(sN−1) · · · a(sN−1) b(sN−1) c(sN−1) d(sN−1) ds e(sN) · · · a(sN) b(sN) c(sN)
x(s1) x(s2) . . . . . . x(sN−1) x(sN)
=
fx(1)(x, y) fx(2)(x, y) . . . . . . fx(N − 1)(x, y) fx(N)(x, y)
. (3.29) If the coefficient matrix is denoted with A the two linear matrix systems for solving the two independent Euler-Lagrange equations can also be written as Ax = fx(x, y) (3.30) Ay = fy(x, y). (3.31) These two matrix equations cannot be solved directly as they are presented
19
we have to introduce a temporal variable t. Thus making the snake not
possible to consider the two matrix equations as a pair of linear differential equations with constant coefficients [Heat-02]. The temporal variable could have been introduced earlier in the analysis, but we choose to wait with introducing it until now to keep the notation as simple as possible. However in order to further the understanding of this approach it might be beneficial to show the basic idea using the continuous form of the Euler-Lagrange
solving ∂x(s, t) ∂t = − ∂ ∂s
∂s
∂s2
∂s2
∂x
. (3.32) When the snake finds a stable minimum the term ∂x(s,t)
∂t
vanishes and we achieve a solution of the original Euler-Lagrange equation. Thus finding a solution to the Euler-Lagrange equations can be viewed as solving an initial value differential equation that evolves towards a steady state, where the initial values are the coordinates for the snake control points. In the discrete domain we can solve the matrix equations 3.30 and 3.31 iteratively by combining both the explicit and implicit Euler method [Heat-02]. By assuming that fx and fy are constant during a time step we can take explicit Euler steps with respect to the external forces while for the internal snake forces we will take implicit time steps since these forces are specified in the coefficient matrix A. This leads to the iterative solution (xt+1 − xt) ∆t = Axt+1 − fx(xt, yt) (3.33) where the superscripts denote the time index and ∆t is the step size. The step size ∆t controls the speed of the snake evolution, large values makes the snake move faster. In order to maintain numerical stability it is however necessary to keep the step size small since we are partly using the explicit method in each iteration. Another disadvantage in using large time steps is that the snake might step over important image features in a single step. Rearranging equation 3.33 to isolate the vector xt+1 results in the final pair
xt+1 =
∆tI −1 1 ∆txt + fx(xt, yt)
yt+1 =
∆tI −1 1 ∆tyt + fy(xt, yt)
(3.35) where I is the identity matrix. Solving the two matrix equations is accom- plished by matrix inversion, which gives the new coordinates for the snake control points, which then again is feed into the equation and so forth. 20
This concludes our analysis of the Kass et al. snake model. As we have seen the mathematical foundation that the Kass et al. snake builds on is quite complex . In the next section the greedy snake algorithm will be examined.
In seeking to improve and correct some of the problems associated with the Kass et al. snake model D. J. Williams and M. Shah developed a snake algorithm dubbed the greedy snake [Williams-92]. One of the problems that
in the Kass et al. snake model are not always evenly spaced. Sometimes the snake control points bunch up in areas of the contour where the im- age energy has high negative values. This behavior causes problems with calculating the curvature since the assumption that the snake parameter is arc length will not hold if the snake points are not equally spaced. The greedy snake algorithm also addresses the problem of numerical instability that might occur if the temporal step size ∆t of the Kass et al. snake is too
tions for the elasticity and curvature terms, are evaluated and new discrete approximations are suggested. Let us begin our analysis of the greedy snake by taking a look at how the image energy is evaluated.
3.2.1 Evaluating the image energy
The image energy is evaluated in a slightly different manner for the greedy snake algorithm than in the Kass et al. snake model, this difference is primarily due to the discrete nature of the greedy snake. The image energy
Eimg = ∇[Gσ(x, y) ∗ I(x, y)]2 (3.36) which is almost the same energy term as in the Kass et al. snake except that there is missing a minus in front of the term. The greedy snake algo- rithm works by examining the neighborhood around each snake point and then moving to the position with the lowest energy. Therefore the image energy in the neighborhood of the snake control point v(si) has to be nor- malized in a manner which assigns large negative values to pixels with high gradient values, while assigning lower negative values to pixels with a lower gradient value. The gradient magnitudes are all in the interval [0, 255]. The normalization of the neighborhood is calculated as location(x, y) = (min − mag(x, y)) (max − min) (3.37) 21
where min is the minimum gradient value in the neighborhood, max the maximum and mag(x, y) the gradient magnitude of the current point. This normalization sets the highest gradient magnitude in the neighborhood to
borhood is nearly uniform in gradient magnitude we get large difference in the normalized values. For instance if all the gradient magnitude values are in the interval [46, 49] then the normalized values would be 0, -0.33, -0.66 and -1, which would suggest a strong edge even when there is none. In order to compensate for this problem the minimum value min is set to max − 5 if max − min < 5. An example of a neighborhood with similar gradient magnitude values and the corresponding image energy values, is given in figure 3.3.
Figure 3.3: Illustration of a 3 × 3 neighborhood around the point v(si) together with the image energy. The red numbers represent the gradient magnitude while the blue numbers are the normalized image energy values.
Figure 3.3 also shows how setting min to max − 5 if max − min < 5 results in a more accurate reflection of the similarity in the gradient values.
3.2.2 The elasticity term of the greedy snake
As we mentioned when describing the Kass et al. snake the elasticity1 term vs(s)2 has the effect of causing the curve to shrink upon itself. The greedy snake utilizes a different way of calculating the elasticity term. Thus reducing the shrinking effect and also making sure that the snake control points does not bunch up in places with high image energy. The elasticity term in the greedy snake is calculated in the neighborhood of each snake control point as ¯ d−v(si)−v(si−1) = ¯ d−
1The elasticity term is called the continuity term by D. J. Williams and M. Shah, but
we will adhere to the name ”elasticity term“ for consistency.
22
where ¯ d is the average distance between all the points in the snake. Once the above term has been calculated for each pixel in the neighborhood of a snake control point all the values are divided by the largest value in the
contains elasticity term values between [0, 1]. The minimum energy will be achieved when ¯ d − v(si) − v(si−1) = 0 (3.39) which will be true for points where the average distance equals the distance between the current and previous point on the snake. This new elasticity term will therefore encourage the snake control points to be evenly spaced along the curve keeping the curve parameterized by arc length. As with the Kass et al. snake energy functional, the influence of the elasticity term is controlled by the parameter α(si). Finding a suitable value for this parameter is equally important in the greedy snake as in the Kass et al. snake. If the parameter α is set too high the snake will not really be able to evolve to fit the contour of an object because the snake curve will not change its length at all.
3.2.3 The curvature term of the greedy snake
In [Williams-92] D. J. Williams and M. Shah evaluate a range of different ways of calculating the curvature for a discrete parametric curve such as the greedy snake curve. Making a compromise between computational intensity and precision the expression v(si+1) − 2v(si) + v(si−1)2. (3.40) is used for computing the curvature for each of the points in the neigh- borhood of the snake point. In essence this is the same expression as we would get if the term vss(si) was approximated using the central finite difference formula seen in 3.25 with h = 1. As mentioned in section 3.1.2 this term does not measure the curvature accurately if the snake is not parameterized by arc length. We can realize this by looking at a discrete example. In figure 3.4(a) we have magnified a part of the curve where the term v(si+1) − 2v(si) + v(si−1)2 would be greater than zero. Since the curve actually does bend in figure 3.4(a) we achive the desired re-
even though the curve does not bend in this part we notice that the term v(si+1) − 2v(si) + v(si−1)2 would be greater than zero. However the con- trol points in the greedy snake a more likely to be evenly spaced than for the Kass et al. snake since the elasticity term encourages even spacing of the control points. The influence of the curvature is controlled by the parameter β as in the Kass et al. snake. 23
Figure 3.4: Illustration showing two different parts of the snake curve. (a) In this part the curve is bending and the points are equally spaced since the two vectors ui and ui+1 have equal length. (b) In this part of the curve the true curvature is zero while the two vectors ui and ui+1 have different lengths.
Once the curvature has been calculated for each point in the neighbor- hood of the current snake control point the values are normalized by dividing with the largest value. So we ends up with all the curvature values being in the range [0, 1] as with the image energy and the elasticity energy.
3.2.4 The algorithm
In the previous sections we have explained how each of the energy terms are calculated for the greedy snake algorithm. In this section we will describe the actual algorithm for how the points are moved. For each point/pixel in the neighborhood of a snake control point v(si) the three energy terms are calculated. Then the algorithm sums the energy terms to get the combined energy Ecomb(x, y) = α(si)Eela(x, y) + β(si)Ecurv(x, y) + γ(si)Eimg(x, y). (3.41) Where Eela(x, y) is the elasticity energy, Ecurv(x, y) is the curvature energy, Eimg(x, y) is the image energy and (x, y) are the indices to the points in the neighborhood. Furthermore we see that the greedy snake algorithm also uses a parameter γ to control the influence of the image energy. Once the combined energy has been calculated for each of the points in the neigh- borhood, the algorithm makes a greedy choice and moves the snake control point to the position that has the minimum combined energy. So the name
figure 3.5. 24
Figure 3.5: Illustrating the movement of a snake control point. The values in the squares represent the combined energy. Also pictured is the snake control point v(si) and the point before and after it. The red arrow shows to which point in the neighborhood the snake control point will move.
Once all the control points along the snake have been moved to a new position the curvature is calculated a second time. This time however the curvature is only calculated once for each control point along the snake and not for all the points in the neighborhood. The reason for calculating the curvature again is to locate places where the curvature is high and then relaxing the parameter β(si) for this control point i.e. setting β(si) = 0. Hereby a corner is allowed to form at this point of the snake. The second time we compute the curvature we use
ui − ui+1 ui+1
(3.42) where ui = [x(si)−x(si−1), y(si)−y(si−1)]T and ui+1 = [x(si+1)−x(si), y(si+1)− y(si)]T . This gives a more accurate estimation of the curvature since we nor- malize by the magnitude of the vectors. We thus avoid the problem of the points having to be equally spaced to get a reliable curvature measure. See figure 3.4 for an example of the two vectors ui and ui+1. The equation 3.42 is not used initially to calculate the curvature for all the points in the neigh- borhood of each snake control points since it is computationally expensive. See also figure 3.6 for the pseudo.code of the greedy algorithm. Once the new and exact curvature has been calculated for all the snake control points the β parameter is relaxed for control points in the snake where the follow- ing conditions hold true. First the curvature of the control point v(si) has to be larger than the curvature for its two neighbors v(si−1) and v(si+1). Second the curvature has to be larger than a preset threshold value, in the pseudo-code of figure 3.6 this threshold is named threshold1. Finally the magnitude of the gradient at the control point also has to be above a certain threshold, threshold2 in figure 3.6. If all these conditions are true then the β value for the control point will be relaxed. When the β value has been relaxed the curvature at the corresponding snake control point does no 25
longer have any influence on the combined energy of the snake and therefore a sharp corner will be able to develop.
% n is the total number of snake control points Index arithmetic for the snake control points is modulo n Initialize the parameters alpha, beta and gamma do % Main loop that moves the snake points to new locations for i = 1 to n % The first and last point in the snake are the same Emin = infinity for j = 1 to m % m is the neighborhood size E(j) = alpha(i) Eela(j) + beta(i) Ecurv(j) + Eimg(j) if E(j) < Emin then % Find location with min energy Emin = E(j) jmin = j Move point v(i) to location jmin if jmin is not the current location then ptsmoved++ % The process below determines where to relax beta for i = 1 to n % Calculate exact curvature c(i) = || u(i) / || u(i) ]] - u(i+1) / || u(i+1)|| ||^2 for i = 1 to n % Find where to relax beta if (c(i) > c(i-1) and c(i) > c(i+1) and c(i) > threshold1 and mag(v(i)) > threshold2 then beta(i) = 0 % Relac beta if all conditions true while ptsmoved > threshold3 % Stop if only few points have moved Figure 3.6: Pseudo-code for the greedy snake algorithm.
The final step in the iteration of the the greedy snake algorithm consists
threshold threshold3, see figure 3.6. This is used as a stopping criterion as the snake is presumed to have reached minimum energy when most of the control points have stopped moving.
In this section extensions to the original algorithms will be presented along with the improvements we have made in order to better the algorithms.
3.3.1 Scale space continuation
One of the problems that might prevent the snake from correctly finding the contours of an object, is the presence of noise in the image. If the image contains noise the initial snake curve has to be placed closer to the
26
snake stopping short before coming in contact with the image energy of the desired contour in the image. To prevent the snake from getting stuck in an undesired local minima created by noise, a technique know as scale space continuation can be applied. This technique was presented in the original paper by Kass et al. [Kass-88] as a way to improve the snakes ability to find the desired object contour even under the influence of noise. The technique is rather straight forward. The idea is to use a large value for σ when first computing the image energy Eimg = −∇[Gσ(x, y) ∗ I(x, y)]2. (3.43) Then let the snake iterate while slowly reducing the value of σ. When first using larger values for σ the noise is mostly smoothed and the snake can more easily pass over noise areas. Secondly the large amount of blurring also increases the capture range of the snake by making the influence of strong gradients stretch further away from the area in which they reside. However the large amount of blurring used in the beginning results in the snake doing a poor job of localizing the edge. Therefore σ is decreased and the snake then slowly adapts to the finer details of the contour. In order to use scale space continuation effectively the image energy is submitted to Min-Max normalization norm(Eimg) = (Eimg − min(Eimg)) (max(Eimg) − min(Eimg)) ∗ (0 − (−1)) + (−1). (3.44) Where norm(Eimg) is the normalized image energy, min(Eimg) the mini- mum value of the image energy and max(Eimg) the maximum value of the image energy. After the Min-Max normalization the maximum values for the normalized image energy takes on the value 0 while the minimum is
constant even when varying σ. If this normalization of the image energy was
The implemented snakes have both been extended with the option of turning scale space continuation on. In the experimental results chapter we will see how turning scale space continuation on helps localizing the edge in noisy images.
3.3.2 Stopping criterion for the Kass et al. snake
In the original paper by Kass et al. [Kass-88] no indication was given as to when the snake evolution should be stopped. In the greedy algorithm we would stop the iterations when either the maximum number of iterations had been exceeded or when the number of snake points moved in the last iteration was below a threshold. Setting an upper limit on the number of 27
iterations run, can of course also be used for the Kass et al. snake. However we cannot use the number of point moved as a stopping criterion for the Kass et al. snake. This is because most of the points in the snake keep moving even when the snake has reached its minimum, the movement at the minimum is however very small. Knowing that the movement of the snake points at the minimum will be quite small, we suggest to stop the snake algorithm when the following term drops below a given threshold v(s)t − v(s)t−1 n . (3.45) Where the vector v(s)t contains the indices to the snake points at time step t and v(s)t−1 contains the snake points at time step t − 1. We divide by n which is the total number of control points in the snake. Usually a greater number of control points will lead to the term v(s)t − v(s)t−1 taking on larger values, which is why we divide by n. This improvement of the Kass et al. snake has been incorporated into
3.3.3 Active resampling of the Kass et al. snake curve
As mentioned in section 3.1.2 the curvature term vss(s) only measures the curvature correctly if the snake control points are equally spaced. An example of this was also given in section 3.2.3 where we examined the discrete
Kass et al. snake algorithm which makes sure that the distances between all the snake control points remain more or less equal. Once the snake has started evolving there is no guarantee that the snake control points are equally spaced, however the snake curve can be dynami- cally resampled while it evolves. The resampling step that we have added to the original Kass et al. snake first computes the average distance between all the snake control points. Then we iterates through all the snake control points while removing points in parts of the snake where the points are close together compared to the average distance. At the same time the resam- pling step also inserts new points in parts of the snake where points are far apart compared to the average distance. When a new point is inserted, it is inserted in the middle of the line connecting the two points that are far
the actual implementation we have, in order to reduce computation, set the resampling to be performed every time the snake has iterated 15 times. Let us take a look at an example and see how adding the resampling changes the result. In figure 3.7 the initial snake is show, it consist of 100 snake control points laid out in a circle around the object we wish to segment. Running the Kass et al. snake, with snake resampling turned
28
is seen in figure 3.8. We notice that when the snake has converged it has increased the number of control points to 195. This is to be expected, since the resampling function is more inclined to add points to the snake rather than remove them. This inclination can however be changed by adjusting a threshold value in the resample function. Adding additional point to the snake actually gives a better fit to the contour, since more points mean that finer details along the contour can be modeled by the curve. Another thing to notice is that the snake in the right half of figure 3.8 is not able to move into the concave part of the object. This is a trait that both the greedy snake and the Kass et al. snake exhibits, and we will discuss it in more detail in the experimental results chapter.
Figure 3.7: The initial state of the snake; 100 snake points all equally spaced, organised in a circle.
29
Figure 3.8: The final state of the snake when using resampling. The final state occurred after 2163 iterations. At this point the snake consisted of 195 snake points, most of them more or less equally spaced.
To compare the result we got when having resampling turned on, we ran the Kass et al. snake algorithm in its original form i.e. with resampling turned off, on the same test image. We set the initial snake to consist of 195 control points to make sure that the end result is directly comparable with the result obtained from having resampling turned on. The converged snake is shown in figure 3.9, this time convergence took 2346 iterations. When comparing the two results we quickly see that not using our re- sampling method gives worse results for the final segmentation. This is most noticeable in the lower left part of the object in figure 3.9 where the snake curve does not follow the contour very well. It is also noticeable that the snake control points are mostly concentrated on the right side of the object in figure 3.9 while being much further apart on the left side. We can there- fore conclude that using our suggested snake resampling technique not only helps keep the points more evenly spaced, which in turn makes the curva- ture term more precise. But also directly improves the segmentation of the
30
Figure 3.9: The final state of the snake without resampling. The final state occurred after 2346 iterations.
3.3.4 Randomizing snake points for the greedy algorithm
The last improvement that has been implemented is concerned with the greedy snake algorithm. It was noted during initial test runs, when imple- menting the greedy snake algorithm, that the snake sometimes would have a tendency to rotate. The rotation is particularly noticeable when the image energy is more or less constant throughout the snake. This rotation is due to the fact that the for-loop, which runs through all the snake points comput- ing their new position, does so consecutively. So if one of the control points in the snake is moved closer to another control point, and the image energy and curvature energy is more or less constant thought the snake, it will tend to push the next control point. This is because the elasticity energy for the greedy snake always tries to keep the points evenly spaced. Once one of the control points has pushed another it can set in motion a chain reaction resulting in the whole snake rotating. To avoid this behavior we have made a small change to the greedy snake
snake control point, we choose the snake control points by random. This approach significantly reduces the tendency for the curve to rotate, as it will be harder for the force of one point pushing the next point to propagate along the curve. It should be noted that the results obtained, when running the same initial snake on the same image, can vary slightly because of the randomization factor. 31
Chapter
This chapter will contain a brief introduction to how the implemented snakes are run, together with an explanation of some of the implementation details. The two snake algorithms have been developed and tested using MAT- LAB R2007a running on Mac OSX version 10.4.10. The program is run from the MATLAB command line and takes 3 command line arguments. All 3 input arguments are strings. The first argument can either be Kass or greedy specifying whether to run the Kass et al. or greedy snake algorithm. The next argument can be either user or circle, this decides whether the snake should be manually input by the user or input as a circle. The last argument specifies whether scale space continuation should be on or off. So for instance if the user wishes to run the greedy snake, input the snake con- trol points manually and have scale space continuation turned off he should input main(’greedy’, ’user’, ’off’) in the command line of the MATLAB console. The file main.m runs the snake program, it also contains nearly all of the parameters and thresholds
it can be done by editing this file. If the user has chosen to input the snake manually the image will be shown and the user then clicks in the position of the image where a snake control point should be inserted. Once finished the user should click somewhere outside the image to start the snake algorithm. The snake program is dependent on the Image Processing Toolbox for MATLAB being installed, as functions from the toolbox are used for doing
image function I(x, y), we use convolution with Sobel filters Gx = −1 1 −2 2 −1 1 ∗ I(x, y) , Gy = 1 2 1 −1 −2 −1 ∗ I(x, y). (4.1) The gradient magnitude used in the image energy terms is then computed 32
as ∇I(x, y) =
x + G2 y.
(4.2) In the Kass et al. snake implementation the value h used in the finite differences is set to h = 1. This speeds up the computation and in practice the snake still evolves satisfactory. Below in figure 4.1 a data-flow diagram is show. This diagram gives an
Figure 4.1: Illustration of the data-flow between the various functions in the implementa- tion.
The main function in main.m contains most of the parameters and thresholds used, furthermore it also handles drawing the snake evolution in the image. The KassSnake function calculates how the snake moves, given the initial position and the image energy, based on the Kass et al. snake
the average distance between all the snake control points in the snake. The getModulo function is used extensively by the GreedySnake function. This is because we want to make sure that when a loop is applied to iterate through all the snake control points the first and last point will be the same. Finally the snakeResample function tries to resample the snake control points so that they are equally spaced along the snake curve. The source code to the implemented program can be found in appendix A. 33
Chapter
Both the greedy snake and the Kass et al. snake, that were analyzed and described in chapter 3, have been implemented in MATLAB. In this chapter we will test these two snakes on different types of images. Some of the images will be synthetic while others will be real images captured by a digital camera. All the synthetic images have been made using Photoshop 10.0.
Figure 5.1: Illustrating an object with a boundary concavity. The initial snake forms a circle around the object and consists of 50 snake points
34
The image we will use in the first test is a synthetic image designed to show one of the weaknesses that the Kass et al. snake, greedy snake and many other snakes have. The problem appears when trying to locate the contour of an object which has a boundary concavity. In figure 5.1 we see the initial snake and the object of which we wish to find the contour. The
snake or the greedy snake is able to move completely into this concavity. The initial snake in figure 5.1 has 50 control points and both the two snakes will start evolving from this position.
Figure 5.2: Finals state of the Kass et al.ˆ
σ = 3, scale space continuation off and resampling on.
In figure 5.2 we see the result for the Kass et al. snake. The snake parameters were α = 0.035, β = 0.0005, σ = 3 and scale space continuation was off while resampling was on. The snake ran 8000 iterations which is the maximum number of iterations. The reason that the snake did not stop sooner is that new points keep being inserted in the horizontal stretch above the cavity. These new points slowly move out to the sides as they are inserted and the snake never converges according to our stopping criterion, see section 3.3.2. From figure 5.1 we clearly see that the snake is not able to move into the cavity. This behavior is caused by a combination of the snakes internal energies and the image energy. The elasticity energy tries to keep the snake from stretching and if the snake is to move down into the cavity the elasticity energy would have to be increased. However if the image energy was somehow pulling the snake downwards into the cavity the 35
elasticity energy could be overcome, but that is not the case. The image energy of 5.1 is only pulling the snake out to the sides of the cavity and not downwards in any way. In figure 5.3 the final state of the greedy snake is shown. For the greedy snake the final state was reached after 55 iterations. The parameters were α = 1, β = 1, γ = 1.2, σ = 3, neighborhood size was 3 × 31 and scale space continuation was off. The red snake control points indicate points for which the β value has been relaxed by the algorithm, so a corner could develop. Figure 5.3 clearly shows that also the greedy snake also has problems with moving into the cavity. Actually it does slightly worse than the Kass et
cavity. If we wish to correctly segment an object with boundary concavities using a snake we must make sure that the initial snake is placed inside the
to the contour. The gradient vector flow snake [Xu-98] which was briefly described in the literature review section should, by itself, be able to move into boundary concavities, but this snake has not been implemented and will therefore not be tested.
Figure 5.3: Final state of the greedy snake. Iterations 55, α = 1, β = 1, γ = 1.2, σ = 3, neighborhood size 3 × 3 and scale space continuation off
1The parameter values α = 1, β = 1, γ = 1.2 and a neighborhood size of 3 × 3 were
recommended by D. J. Williams and M. Shah in their paper [Williams-92].
36
This test is designed to examine the performance of the two snakes on noisy images, both with and without using scale space continuation. The image seen in figure 5.4 shows a black square on a white background. A high de- gree of Gaussian noise has been added to the image. The noise was added in MATLAB with the command noisyImg = imnoise(img,’gaussian’,0.5,2);, where 0.5 is the mean and 2 is the variance of the Gaussian. As in the last test the initial snake curve consists of 50 control points placed in a circle around the object we with to find the contour of.
Figure 5.4: Image of a black square on a white background with a high degree of noise. Initial snake consists of 50 snake control points.
In the first two test runs we will run the snakes with scale space con- tinuation turned off. When scale space continuation is turned off we only blur the image once with a Gaussian of σ = 3 and then let the snake run its course on the blurred image. Figure 5.5 shows the final state of the Kass et
resampling on. Unfortunately the snake was not able to converge according to our stopping criterion and ran all 8000 iterations. Even though the snake runs 8000 iterations it actually moves very little, since it quickly gets stuck
37
Figure 5.5: Final state of the Kass et al. snake. Iterations 8000, α = 0.05, β = 0.0005, σ = 3, scale space continuation off and resampling on. Figure 5.6: Final state of the greedy snake. Iterations 5, α = 1, β = 1, γ = 1.2, σ = 3, neighborhood size 5 × 5 and scale space continuation off.
38
Figure 5.6 shows the final state of the greedy snake on the same image. For the greedy snake the parameters were set at α = 1, β = 1, γ = 1.2, σ = 3 and a neighborhood of size 5 × 5. Again we observe that the snake quickly gets stuck because of the noise. Actually the greedy snake stops after only 5 iterations in this example. From these results it is clear that the amount of noise added presents a significant challenge to both of the snake algorithms. For the next two test runs we will turn scale space continuation on. This should help in making the snakes more robust in the presence of noise. The implemented scale space continuation uses 4 different scales. Starting at a rough scale with σ = 15 and then reducing σ by 4 until we reach a scale of σ = 3. At each individual scale the snake is allowed to run until it converges
In figure 5.7 the final results of the Kass et al. snake, with scale space continuation on, is shown. It took 4300 iterations for the snake to converge to this result, and the parameters were α = 0.05, β = 0.0005, scale space continuation on and resampling on. It is quite evident from looking at figure 5.7 that scale space continuation helps make the Kass et al. snake more robust. We can now actually see that the snake has found the contour
The corresponding result for the greedy snake is shown in figure 5.8. The parameters were α = 1, β = 1, γ = 1.2, σ = 3, neighborhood size 5 × 5 and the number of iterations was 76. Again we see that scale space continuation helps significantly, which was to be expected also for the greedy snake. The two snakes both find the contour quite well considering the amount
slightly better than the greedy snake. The greedy snake does not find the lower left corner of the square in figure 5.8. 39
Figure 5.7: Final state of the Kass et al. snake with scale space continuation on. Iterations 4300, α = 0.05, β = 0.0005 and resampling on. Figure 5.8: Final state of the greedy snake with scale space continuation on. Iterations 76, α = 1, β = 1, γ = 1.2 and neighborhood size 5 × 5.
40
Now that we have tested the snakes on two synthetic images we will try to apply them to a real image. The image is cut out of a larger image showing a number of leafs lying on a table. This image has previously been used in the image processing course at DIKU and can be found on DIKU’s server at /usr/local/del1/datV-billed/matlab/data/. The initial snake has been initialized manually for this test. This was done to illustrate how a manually initialized snake should be placed, but also because placing the snake in a circle around the leaf gave bad results. In figure 5.9 the manually placed initial snake can be seen. There is 78 snake control points in the initial snake. In figure 5.10 we see the final result for the Kass et al. snake. The parameters were α = 0.035, β = 0.0005, resampling on and scale space continuation on. The snake converged after 6161 iterations. We see that the snake has found the general shape of the leaf contour quite well. There is however some problems with the upper right corner and lower left corner of the leaf. This can be attributed to the fact the the image is quite blurry in this part so the exact transition between the table and the leaf is hard to make out.
Figure 5.9: Image showing a leaf laying on a table. Initial snake consists of 78 snake control points.
41
Figure 5.10: Final state of the Kass et al. snake. Iterations 6161, α = 0.035, β = 0.0005, resampling on and scale space continuation on. Figure 5.11: Final state of the greedy snake. Iterations 128, α = 1, β = 1, γ = 1.2, neighborhood size 5 × 5 and scale space continuation on.
42
The final position of the greedy snake is shown in figure 5.11. The parameters were α = 1, β = 1, γ = 1.2, neighborhood size 5 × 5 and scale space continuation on. While the number of iterations run were 128. The greedy snake also seems to capture the general contour of the leaf. However there is a few more errors made, compared to the Kass et al. snake. As with the Kass et al. snake the greedy snake also has problems with the upper right corner and the lower left corner of the leaf. Furthermore the greedy snake also has some problems with the upper left corner and the tip
In this test we will use the two snakes to find the contour of a shark tooth. In figure 5.12 we see the shark tooth lying on some uneven pink fabric. Around the tooth is the initial snake with 50 snake control points.
Figure 5.12: Image of a shark tooth. The initial snake, that is placed in a circle around the tooth, consists of 50 snake control points.
The shark tooth image is one out of a small data sample of shark tooth
shark species automatically, based on an image of one of the sharks teeth. In order to achieve this, a good segmentation of the tooth has to be obtained
the species of the shark based on the shape of the tooth. The classification 43
could perhaps be done using neural networks or linear classification models [Bishop-06]. This possibility will however not be examined further in this project.
Figure 5.13: Final state of the Kass et al. snake. Iterations 8000, α = 0.05, β = 0.0005, resampling on and scale space continuation on.
Figure 5.13 shows the final position of the Kass et al. snake. The param- eters were α = 0.05, β = 0.0005, resampling on and scale space continuation
the tooth. Only very small errors are made. Likewise for the greedy snake algorithm, for which the result is shown in figure 5.14. The greater number of points in the resampled Kass et al. snake, does however lead to a slightly better result for the Kass et al. snake. The red snake control points in figure 5.14 shows where the β values have been relaxed because of a high degree of curvature. Even though we did not use manual initialization of the snake control points, but just placed them in a circle around the tooth, we were able to get a good segmentation. This might not have been expected considering the somewhat bumpy fabric the tooth is placed on. These result indicate that using a snake to segment the shark teeth might be a good starting point for a full system designed to classify shark species. 44
Figure 5.14: Final state of the greedy snake. Iterations 136, α = 1.2, β = 1, γ = 1.2, neighborhood size 5 × 5 and scale space continuation on.
Now that we have seen how well both of the two snakes find different object contours we will briefly examine the computational speed. In the table the time it takes each snake to run 100 iterations is shown. Snake Running time for a 100 iterations Kass 0.893994 seconds Greedy 4.111357 seconds
Table 5.1: Comparing the running time of the Kass et al. snake to the running time of the greedy snake.
The test were run on a MacBook Pro 1.86 GHz. with 1 GB ram. The shark tooth image was used with the following parameters. Kass et al.: α = 0.05, β = 0.0005, resampling on and scale space continuation on. Greedy: α = 1.2, β = 1, γ = 1.2, neighborhood size 5×5 and scale space continuation
The Kass et al. snake is seen to be significantly faster than the greedy snake when it comes to running a hundred iterations. In practice however 45
the Kass et al. snake also has to complete a far greater number of iterations to converge. Thus in reality the greedy snake actually converges faster than the Kass et al. snake.
Our experimental results show that snakes can be used to segment a variety
greatly reduced the influence of noise in the images. Comparing the results from both the Kass et al. snake and the greedy snake leads us to the conclusion that the Kass et al. snake gives slightly better results overall. One of the reasons for the better results is of course that our resampling method increases the number of control points which enables the snake to find the contour of finer details. However if we try to increase the number of points in the greedy snake, the snake point neighbor- hoods can start to overlap. This leads to undesired effects such as the snake curve overlapping in some places, or even that the distance between snake points begins to increase. Therefore we recommend to use around 50 snake control points in the greedy snake, this number can of course be increased if high resolution images are used. We also recommend that if the object to be segmented contains bound- ary concavities and noise that the initial snake is manually initialized. The closer the initial snake is to the desired contour the greater the probability is of the snake also converging to the desired contour. Having to initialize the snake close to the desired contour can of course present some problems if a completely automatic system for contour detection is sought after. The problem of needing to find a good initial position to increase the chance of finding the desired contour is actually one of the inherent problems with
the snake curve. Another problem with snakes is the fact that the parameters of the snake
based on trial and error. This process can often be time consuming. In the above test runs the parameters were adjusts for each snake in each image to give the best possible result. 46
Chapter
The main goal of this project was to compare two different methods within the active contour framework. The active contour methods that were chosen for comparison was the Kass et al. snake and the greedy snake. The goal of comparing these two methods has been reached.
We have throughout the project only been considering snakes that form closed curves. One possible extension could be to extend the implemented program to also deal with open curve snakes. With an open curve snake it would be possible to find contours in the image that does not form closed
Extending the Kass et al. snake into handling open curve contours is done by removing the cyclic boundary conditions. This results in a slightly different form of the coefficient matrix A. More details for developing an open curve snake is found in [Waite-90]. The greedy snake could also be extended to work with open curves by removing the use of modulo arithmetic when looping through all the snake control points. Another possible extension could be to connect the snake control points using B-splines. So far the snake control points have only been connected using straight line segments. Using the snake control points as basis for fitting B-splines gives a more smooth snake curve which usually fits the true contour better. Applying B-splines as basis for active contours is the subject
One last extension that might be be interesting to pursue would be to try and find a way to automatically estimate the optimal values for the snake parameters α and β. The final state of converge of a snake is very dependent on the value of these parameters, which is why the parameters are manually adjusted to give the desired result. If this step was automated, the somewhat time consuming task of adjusting these parameters could be
47
A literature review of four different snake models were given, Two of these, the Kass et al. snake and the greedy snake, were analyzed in detail and implemented in MATLAB. A number of improvements to both the Kass et
the Kass et al. snake gave the most significant increase in the precision of the snake. The two snake models were then tested on a number of different images to highlight the conditions required in order to have the snakes per- form satisfactory. The experimental results also made it possible to closely compare the performance of each snake model. All in all the main goal of the project, to compare two different active contour models, has been fulfilled. Along the way the questions asked in the problem description has been answered. It was explained what an active contour is and how it works. The literature review gave an overview of what separates the different active contour methods. The source code in appendix A shows how to implement an active contour in MATLAB. In the experimental results section it was established that under most conditions an active contour can perform satisfactory, but in images with boundary concavities problems can occur. It was also established that the strength of active contours is that they are versatile and can fit a great number of different shapes. Of weaknesses can be mentioned the fact that the initial snake curve has to be placed close to the contour, and that the parameters of the snake has to be adjusted manually. 48
Appendix
%% INFO % % main % This is the main file for the snake program. This % file contains most of all the parameters and % threshold used in the two snake algorithm. % % Arguments: type - If this has value ’Kass’ the Kass et al. snake % algorithm will be invoked. If the value is ’greedy’ % the greedy snake algorithm will be invoked. % input - Can take the values ’user’ and ’circle’. This % decides whether to let the user input the snake control % points or use the default circle. % ssc - Can either be ’on’ or ’off’. This turns scale space % continuation on/off. % % Output: Visual output shoving how the snake evolves. % % Author: Nikolas Petteri Tiilikainen % Department of Computer Science % University of Copenhagen (DIKU) % 2007 %% function main(type, input, ssc) close all % Set image path pathName = ’test images/’; % Define name of image file imgName = ’shark1.png’; % Load the image file
49
% Convert image to grayScale if necessary fileInfo = imfinfo([pathName imgName]); if strcmp(fileInfo.ColorType, ’truecolor’) img = rgb2gray(originalImg); else img = originalImg; end % If input = user, then let the user input the snake control points if strcmpi(input, ’user’) % Create the input figure window figure(’Name’, ’Snake: Insert control points’, ’NumberTitle’, ’off’, ’Resize’, ’on’); imshow(originalImg); title(’\fontsize{13}\fontname{Monospaced} Click outside of image to finish.’); hold on; % Counter for the total number of points numPoints = 0; % Input loop - lets user enter points while (true) % Wait for mouse input waitforbuttonpress; % Get the indices of the new point point newP=get(gca,’CurrentPoint’); newP=newP(1,1:2); % Check if point is outside of the image if (newP(2)>size(img, 1) || newP(1)>size(img, 2) || ... newP(2)< 1 || newP(1)< 1) break; end numPoints = numPoints + 1; points(1, numPoints)=(newP(1)); points(2, numPoints)=(newP(2)); % Plot the new control point plot(points(1, numPoints),points(2, numPoints), ... ’o’, ... ’MarkerSize’, 5, ... ’MarkerFaceColor’, ’b’, ... ’MarkerEdgeColor’, ’b’); end %points = load(’points.txt’); %savefile = ’points.txt’; %save(savefile, ’points’, ’-ASCII’);
50
else % Plot the snake as a circle around the object in the image % Circle radius r = 70; % Cicle center [x y] c = [150 110]; % Number of points in the snake N = 50; % Calculate snake points in a circle points(1, :) = c(1)+floor(r*cos((1:N)*2*pi/N)+0.5); points(2, :) = c(2)+floor(r*sin((1:N)*2*pi/N)+0.5); end C = {points}; % Show initial snake showSnake(C, originalImg); pause(0.1); figure; % Run the snake algorithm if strcmpi(type, ’Kass’) % alpha: controls elasticity % beta: controls curvature % delta: controls step size % sigma: controls amount of Gaussian blurring % maxIt: Defines the maximum number of snake iterations % rs: Controls whether to have resmapling on or off alpha = 0.05; beta = 0.0005; delta = 1; sigma = 3; maxIt = 8000; rs = ’on’; %alpha = 0.035; % Use scale space continuation if ssc = on if strcmpi(ssc, ’on’) sigma = 15; iteration = ceil(maxIt/4); C = cell(0); for i = 1:4 Ctmp = KassSnake(points, img, alpha, beta, delta, sigma, iteration, rs); points = Ctmp{end}; sigma = sigma - 4; C = [C; Ctmp]; end else C = KassSnake(points, img, alpha, beta, delta, sigma, maxIt, rs); end fprintf(’\n’); fprintf(’Running %s snake with following parameters: \n’, type); fprintf(’Alpha: %d \n’, alpha); fprintf(’Beta: %d \n’, beta);
51
fprintf(’Delta: %d \n’, delta); fprintf(’Sigma: %d \n’, sigma); fprintf(’Max iterations: %d \n’, maxIt); fprintf(’Resampling: %s \n’, rs); fprintf(’Scale space continuation: %s \n’, ssc); elseif strcmpi(type, ’greedy’) % alpha: controls continuity (higher numbers result in points being % equally spaced.) % beta: controls curvature % gamma: controls strength of image energy % s: controls the size of the neighborhood % sigma: controls amount of Gaussian blurring % maxIt: Defines the maximum number of snake iterations alpha = 1.2; beta = 1; gamma = 1.2; s = 5; sigma = 3; maxIt = 200; % Use scale space continuation if ssc = on if strcmpi(ssc, ’on’) sigma = 15; iteration = ceil(maxIt/4); C = cell(0); for i = 1:4 Ctmp = GreedySnake(points, img, alpha, beta, gamma, s, sigma, iteration); points = Ctmp{end}; sigma = sigma - 4; C = [C; Ctmp]; end else C = GreedySnake(points, img, alpha, beta, gamma, s, sigma, maxIt); end fprintf(’\n’); fprintf(’Running %s snake with following parameters: \n’, type); fprintf(’Alpha: %d \n’, alpha); fprintf(’Beta: %d \n’, beta); fprintf(’Gamma: %d \n’, gamma); fprintf(’Neighborhood size: %d \n’, s); fprintf(’Sigma: %d \n’, sigma); fprintf(’Max iterations: %d \n’, maxIt); fprintf(’Scale space continuation: %s \n’, ssc); end % Show snake evolution showSnake(C, originalImg, beta); clear all %% showSnake % Subfunction that shows the evolution of the snake. %
52
% Arguments: C - Cell array containing indices to the snake points for % all the iterations of the snake. % img - The image that the snake algorithm is running on % betaStart - The starting value for the beta parameter, % used to show wich points have had their beta value changed % by displaying them in red. % % Output: Figure showing the snake evolving. function showSnake(C, img, betaStart) it = size(C, 1); if it < 200 step = 1; else step = floor(it/100); end for i = 0:step:it cla; imshow(img); hold on; if it == 1 title(’\fontsize{13}\fontname{Monospaced} Initial snake’); points = C{1}; else if i == 0 points = C{i+1}; title([’\fontsize{13}\fontname{Monospaced} Iteration number: ’, num2str(i+1)]); else points = C{i}; title([’\fontsize{13}\fontname{Monospaced} Iteration number: ’, num2str(i)]); end end % Plot lines between points plot(points(1,:), points(2,:), ... ’-g’, ... ’LineWidth’, 3); plot([points(1,end) points(1,1)], [points(2,end) points(2,1)], ... ’-g’, ... ’LineWidth’, 3); % Plot points, change colour of points where % the beta value is relaxed for j = 1:size(points, 2); if size(points, 1) == 2 plot(points(1,j), points(2,j), ... ’o’, ... ’MarkerSize’, 7, ...
53
’MarkerFaceColor’, ’b’, ... ’MarkerEdgeColor’, ’b’); elseif points(4,j) ~= betaStart plot(points(1,j), points(2,j), ... ’o’, ... ’MarkerSize’, 7, ... ’MarkerFaceColor’, ’r’, ... ’MarkerEdgeColor’, ’r’); else plot(points(1,j), points(2,j), ... ’o’, ... ’MarkerSize’, 7, ... ’MarkerFaceColor’, ’b’, ... ’MarkerEdgeColor’, ’b’); end end % Delay between each iteration pause(0.005); end
%% INFO % % KassSnake % Implementation of the Kass et al. snake algorithm % [Kass, Witkin and Terzopoulos - 1988] % % Arguments: points - A matrix of vectors, where the first row of each % column contains the x coordinate of the point and the % second row of each column contains the y coordinate of the % point. % img - The image the snake is being run on. % alpha - Controls the elasticity of the snake. % beta - Controls curvature. % delta - Controls the step size. % sigma - Controls the amount of Gaussian blurring % maxIt - The maximum amount of iteratins to run. % rs - Controls whether to actively resample the snake or %
% all other values means it will be turned off. % % Output: cellArray - A cell array containing each iteration of the % resulting snake. Each cell contains the indices for one % iteration and the last cell contains the final position %
% % Author: Nikolas Petteri Tiilikainen % Department of Computer Science % University of Copenhagen (DIKU)
54
% 2007 %% function [cellArray] = KassSnake(points, img, alpha, beta, delta, sigma, maxIt, rs) x = points(1,:)’; y = points(2,:)’; % Thresholds used in terminating the algorithm stopThresh = 0.0008; stop = 0; scale = 1; % Get number of points in the snake n = size(points, 2); % Preallocations for increased code efficiency cellArray = cell(maxIt, 1); % Get the image energy enrgImg = -getImgEnrg(img, sigma); % Normalize image energy by Min-Max normalization % A = (A - minA)/(maxA - minA) * (new_maxA - new_minA) + new_minA maxEnrgImg = max(max(enrgImg)); minEnrgImg = min(min(enrgImg)); enrgImg = (enrgImg - minEnrgImg)/(maxEnrgImg - minEnrgImg) * (0 - (-1)) + (-1); % Show the image energy (FOR TESTING PURPOSE) %figure, imshow(enrgImg,[]), title(’Image energy’) %pause(1) % Find the derivatives of the image energy function fy = fspecial(’sobel’); fx = fy’; gradY = imfilter(enrgImg, fy, ’replicate’); gradX = imfilter(enrgImg, fx, ’replicate’); % Initialize the alpha and beta values for each snake point points(3,:) = alpha; points(4,:) = beta; h = 1; % Construct the A matrix A = constructA(points, n, h); invAI = inv(A + (1/delta)*eye(n)); % Evolve the snake for i = 1:maxIt if strcmpi(rs, ’on’)
55
% Resample snake for each 15 iterations if mod(i, 15) == 0 [points] = snakeResample([[x y]’; points(3:4,:)]); n = size(points, 2); x = points(1,:)’; y = points(2,:)’; A = constructA(points, n, h); invAI = inv(A + (1/delta)*eye(n)); end scale = 0.47; end % Interpolate to find the image energy on the discrete grid enrgX = interp2(gradX, x, y, ’*linear’); enrgY = interp2(gradY, x, y, ’*linear’); % Calculate new snake point indices x = invAI * ((1/delta)*x + enrgX); y = invAI * ((1/delta)*y + enrgY); % Stopping criterion check if i > 1 previous = cellArray{i-1}; if size(previous(1:2,:)) == size([x y]’) if (norm([x y]’ - previous(1:2,:))/n)*scale < stopThresh break; end end end cellArray(i) = {[[x y]’; points(3:4,:)]}; stop = i; end fprintf(’Number of snake control points at termination: %d \n’, n); % Delete cells that were not used cellArray(stop+1:end) = []; %% constructA % Subfunction that assembles the coefficient matrix A. % % Arguments: points - A matrix of vectors, where the first row of each % column contains the x coordinate of the point and the % second row of each column contains the y coordinate of the % point. % n - The total number of control points along the snake % curve. % h - Small constant used in the finite difference % approximation. %
56
% Output: A - The coefficient matrix A. function [A] = constructA(points, n, h) alphaP1 = [points(3,n) points(3,1:n-1)]; betaM1 = [points(4,2:n) points(4,1)]; betaP1 = [points(4,n) points(4,1:n-1)]; % Produce the five diagonal vectors a = betaM1/h^4; b = -2*(points(4,:)+betaM1)/h^4 - points(3,:)/h^2; c = (betaP1+4*points(4,:)+betaM1)/h^4 + (alphaP1+points(3,:))/h^2; d = -2*(betaP1+points(4,:))/h^4 - alphaP1/h^2; e = betaP1/h^4; % Assemble the A matrix B = [d’ e’ a’ b’ c’ d’ e’ a’ b’]; B = fliplr(B); A = full(spdiags(B, [-(n-1) -(n-2) -2 -1 0 1 2 (n-2) (n-1)], n, n))’;
%% INFO % % GreedySnake % Implementation of the greedy snake algorithm % [Williams & Shah - 1992] % % Arguments: points - A matrix of vectors, where the first row of each % column contains the x coordinate of the point and the % second row of each column contains the y coordinate of the % point. % img - The image the snake is being run on. % alpha - Controls the elasticity/continuity of the snake. % beta - Controls curvature. % gamma - Controls strength of image energy. % s - Controls the size of the neighborhood. The % neighborhood is set to contain s^2 pixels. % sigma - Controls the amount of Gaussian blurring % maxIt - The maximum amount of iteratins to run. % % Output: cellArray - A cell array containing each iteration of the % resulting snake. Each cell contains the indices for one % iteration and the last cell contains the final position %
% % Author: Nikolas Petteri Tiilikainen % Department of Computer Science % University of Copenhagen (DIKU) % 2007 %% function [cellArray] = GreedySnake(points, img, alpha, beta, gamma, s, sigma, maxIt)
57
% Set the curvature threshold cThreshold = 0.3; % Set the image energy threshold imgEnrgT = 120; % Define counter for the number of iterations counter = 0; % Initialize the alpha, beta and gamma values for each snake point points(3,:) = alpha; points(4,:) = beta; points(5,:) = gamma; % Round indices of snake points points(1:2,:) = round(points(1:2,:)); % Get the image energy enrgImg = getImgEnrg(img, sigma); % Get number of points in the snake n = size(points, 2); % Get average distance between points avgDist = getAvgDist(points, n); % Calculate the area of the vicinity a = s^2; % Calculate the distance in each direction from the center of the vicinity dist = floor(s/2); % Calculate the offsets needed when examining the vicinity tmp = repmat(( (1:s)-s+dist ), s, 1);
% Get subscript indices corresponding to the linear indices of the vicinity [I,J] = ind2sub([s,s],1:a); % Preallocations for increased code efficiency Econt = zeros(1,a); Ecurv = zeros(1,a); Eimg = zeros(1,a); c = zeros(1,n); cellArray = cell(maxIt, 1); % Main loop that evolves the snake flag = true; while flag % Counter for the number of points moved pointsMoved = 0;
58
% Iterate through all snake points randomly p = randperm(n); for i = p(1:n) % Use modulo arithmetic since the curve is closed [modI, modIminus, modIplus] = getModulo(i, n); % Extract pixels in the neighborhood of the current snake point neighborhood = enrgImg((points(2, modI)-dist):(points(2, modI)+dist), ... (points(1, modI)-dist):(points(1, modI)+dist)); % Normalise the image energy as suggested in the article % [Williams & Shah - 1992] enrgMin = min(min(neighborhood)); enrgMax = max(max(neighborhood)); if (enrgMax - enrgMin) < 5 enrgMin = enrgMax - 5; end normNeigh = (enrgMin - neighborhood) / (enrgMax - enrgMin); % Calculate energy terms for all pixels in the neighborhood for j = 1:a % Current position pos = points(1:2,i) + offsets(j,:)’; % Calculate the continuity term Econt(j) = abs(avgDist - norm(pos - points(1:2, modIminus))); % Calculate the curvature term Ecurv(j) = norm(points(1:2, modIminus) - 2*pos + points(1:2, modIplus))^2; % Calculate the image energy term Eimg(j) = normNeigh(I(j), J(j)); end % Normalize the continuity and curvature terms to lie in the range [0,1] Econt = Econt / max(Econt); Ecurv = Ecurv / max(Ecurv); % Sum the energy terms Esnake = points(3,i)*Econt + points(4,i)*Ecurv + points(5,i)*Eimg; % Find the location of minimum energy in the neighborhood [dummy,indexMin] = min(Esnake); % If we have a new point if ceil(a/2) ~= indexMin % Move point to new location
59
points(1:2, modI) = points(1:2, modI) + offsets(indexMin,:)’; % Increment counter pointsMoved = pointsMoved + 1; end % Store the value of the image energy points(6, modI) = neighborhood(I(indexMin),J(indexMin)); end % Iterate through all snake points to find curvatures for i = 1:n % Use modulo arithmetic since the curve is closed [modI, modIminus, modIplus] = getModulo(i, n); % Estimate the curvature at each point ui = points(1:2, modI) - points(1:2, modIminus); uiPlus = points(1:2, modIplus) - points(1:2, modI); c(i) = norm( ui/norm(ui) - uiPlus/norm(uiPlus) )^2; end % Iterate through all snake points to find where to relax beta for i = 1:n % Use modulo arithmetic since the curve is closed [modI, modIminus, modIplus] = getModulo(i, n); if ( c(modI) > c(modIminus) && ... c(modI) > c(modIplus) && ... c(modI) > cThreshold && ... points(6, modI) > imgEnrgT && ... points(4, modI) ~= 0 ) points(4, modI) = 0; disp([’Relaxed beta for point nr. ’, num2str(i)]); end end counter = counter + 1; cellArray(counter) = {points}; if (counter == maxIt || pointsMoved < 3) flag = false; cellArray = cellArray(1:counter); end avgDist = getAvgDist(points, n);
60
end
%% INFO % % SnakeResample % This function resamples the snake curve. The resampling is % done by inserting points in parts of the snake where the % snake control points are far apart compared to the average %
% snake where they are close together. % % Arguments: points - A matrix of vectors, where the first row of each % column contains the x coordinate of the point and the % second row of each column contains the y coordinate of the % point. % % Output: newPoints - A matrix of vectors containing the new snake %
% coordinate of the point and the second row of each column % contains the y coordinate of the point. % % Author: Nikolas Petteri Tiilikainen % Department of Computer Science % University of Copenhagen (DIKU) % 2007 %% function [newPoints] = snakeResample(points) % Get number of points in the snake n = size(points, 2); % Get number of rows in the points matrix rows = size(points, 1); % Get the average distance between snake points avgDist = getAvgDist(points, n); % Calculate distance between each pair of points dist = zeros(n,1); for i = 1:n dist(i) = norm(points(1:2, i) - points(1:2, mod(i,n)+1)); end % Find places in the snake where additional control points % needs to be inserted insertAt = find(dist >= 1.3*avgDist); % Number of new points that should be added add = length(insertAt);
61
% Find places in the snake where control points % needs to be removed removeAt = find(dist <= 0.6*avgDist); % Number of points that should be removed remove = length(removeAt); % Calculate number of points in the resampled snake newPoints = zeros(rows, n+add-remove); m = 0; i = 1; % Loop that does the actual resampling while i <= n [modI, modIminus, modIplus] = getModulo(i, n); if any(insertAt == i) newPoints(:, i+m) = points(:, i); newPoints(1, i+1+m) = ( points(1, modIplus) - points(1, modI) )/2 + points(1,modI); newPoints(2, i+1+m) = ( points(2, modIplus) - points(2, modI) )/2 + points(2,modI); if rows == 3 newPoints(3, i+1+m) = ( points(3, modIplus) + points(3, modI) )/2; elseif rows == 4 newPoints(3, i+1+m) = ( points(3, modIplus) + points(3, modI) )/2; newPoints(4, i+1+m) = ( points(4, modIplus) + points(4, modI) )/2; elseif rows == 5 newPoints(3, i+1+m) = ( points(3, modIplus) + points(3, modI) )/2; newPoints(4, i+1+m) = ( points(4, modIplus) + points(4, modI) )/2; newPoints(5, i+1+m) = ( points(5, modIplus) + points(5, modI) )/2; end m = m + 1; else newPoints(:, i+m) = points(:, i); end % Remove points if any(removeAt == i) newPoints(:, i+1+m) = points(:, modI); m = m - 1; end i = i + 1; end
%% INFO % % getImgEnrg
62
% Function that calculates the image energy. % % Arguments: img - The input image for which the energy should % be calculated. % sigma - The sigma value used in the Gauss filter. % % Output: enrgImg - The image energy function. % % Author: Nikolas Petteri Tiilikainen % Department of Computer Science % University of Copenhagen (DIKU) % 2007 %% function [enrgImg] = getImgEnrg(img, sigma) % Build Gauss filter fSize = [ceil(3*sigma) ceil(3*sigma)]; gf = fspecial(’gaussian’, fSize, sigma); % Apply Gauss filter to image gaussImg = double(imfilter(img, gf, ’replicate’)); % Find gradients using a Sobel filter fy = fspecial(’sobel’); fx = fy’; Iy = imfilter(gaussImg, fy, ’replicate’); Ix = imfilter(gaussImg, fx, ’replicate’); enrgImg = sqrt(Ix.^2 + Iy.^2);
%% INFO % Function that calculates the average distance between % all the points in the snake. % % Arguments: points - A matrix of vectors, where the first row of each % column contains the x coordinate of the point and the % second row of each column contains the y coordinate of the % point. % n - Total number of points in the snake. % % Output: avgDist - The average distance. % % Author: Nikolas Petteri Tiilikainen % Department of Computer Science % University of Copenhagen (DIKU) % 2007 %% function [avgDist] = getAvgDist(points, n) sum = 0;
63
for i = 1:n sum = sum + norm(points(1:2, i) - points(1:2, mod(i,n)+1)); end avgDist = sum/n;
%% INFO % Function that calculates the index arithmetic using % modulo, this is necessary when the snake forms a closed % curve. % % Arguments: i - The current index. % n - The number of iterations in the loop. % % Output: modI - The current index i modulo n, if i = n we return n % insteaad of 0. % modIminus - This equals modI - 1, if modI - 1 = 0 we % return n instead of 0. % modIplus - This equals modI + 1, if modI + 1 > n we return % 1 instead of n+1. % % Author: Nikolas Petteri Tiilikainen % Department of Computer Science % University of Copenhagen (DIKU) % 2007 %% function [modI, modIminus, modIplus] = getModulo(i, n) modI = mod(i,n); if modI == 0 modI = n; end modIminus = modI - 1; modIplus = modI + 1; if modIminus == 0 modIminus = n; end if modIplus > n modIplus = 1; end
64
[Bishop-06] C. M. Bishop. Pattern Recognition and Machine Learning. Springer, first edition, 2006. ISBN 0387310738. [Blake-00] A. Blake and M. Isard. Active Contours. Springer, first edi- tion, 2000. ISBN 3540762175 http://www.robots.ox.ac.uk/ ~contours/. [Caselles-97] V. Caselles, R. Kimmel, and G. Sapiro. Geodesic active con- tours. International Journal of Computer Vision, 22(1):61–79, 1997. [Cohen-91] L. D. Cohen. On active contour models and balloons. Com- puter Vision, Graphics, and Image Processing. Image Under- standing, 53(2):211–218, 1991. http://citeseer.ist.psu.edu/ cohen91active.html. [Cohen-93] L. D. Cohen and I. Cohen. Finite-element methods for active contour models and balloons for 2-d and 3-d images. PAMI, 15(11):1131–1147, November 1993. http://citeseer.ist.psu. edu/cohen91finite.html. [Heat-02] M. T. Heat. Scientific Computing, An Introductory Survey. McGraw-Hill, second edition, 2002. ISBN 007112229X. [Kass-88] M. Kass, A. Witkin, and D. Terzopoulos. Snakes: Active contour
1988. [Nixon-02] M. S. Nixon and A. S. Aguado. Feature Extraction and Image
[Sagan-69] H. Sagan. Introduction to the Calculus of Variations. McGraw- Hill, first edition, 1969. [Salomon-06] D. Salomon. Curves and Surfaces for Computer Graphics. Springer, first edition, 2006. ISBN 0387241965. 65
[Waite-90] J. B. Waite and W. J. Welsh. Head boundary location using
[Williams-92] D. J. Williams and M. Shah. A fast algorithm for active contours and curvature estimation. CVGIP: Image Underst., 55(1):14–26, 1992. [Xu-98]
Snakes, shapes, and gradient vector flow. IEEE Transactions on Image Processing, 7(3):359–369,
66