5 13 19
play

5/13/19 Background The Effects of the New York State Sepsis: the - PDF document

5/13/19 Background The Effects of the New York State Sepsis: the dysregulated immune response to infection with life-threatening organ dysfunction Sepsis Regulations on Pediatric Sepsis Outcomes In children: 89 cases per 100,000


  1. 5/13/19 Background The Effects of the New York State • Sepsis: the dysregulated immune response to infection with life-threatening organ dysfunction Sepsis Regulations on Pediatric Sepsis Outcomes • In children: – 89 cases per 100,000 children – Mortality 5-20% – Costs $52,000 – $65,000 per patient admission Kristin Hittle Gigli, PhD, RN, CPNP-AC • Early recognition and treatment saves lives Post-doctoral scholar Department of Critical Care Medicine University of Pittsburgh BalamuthPed Crit Care Med 2014; Mayer Virulence 2014 ; Evans JAMA 2018 New York state’s 2013 regulations were a landmark policy response • Diagnosing sepsis is difficult • May lead to overuse of antibiotics, invasive “Rory’s Regulations” procedures 1. Early recognition • Prescriptive medical care 2. Protocols for treatment 3. Mandatory reporting of sepsis outcomes Hershey NEJM 2017 Klompas CCM 2019 
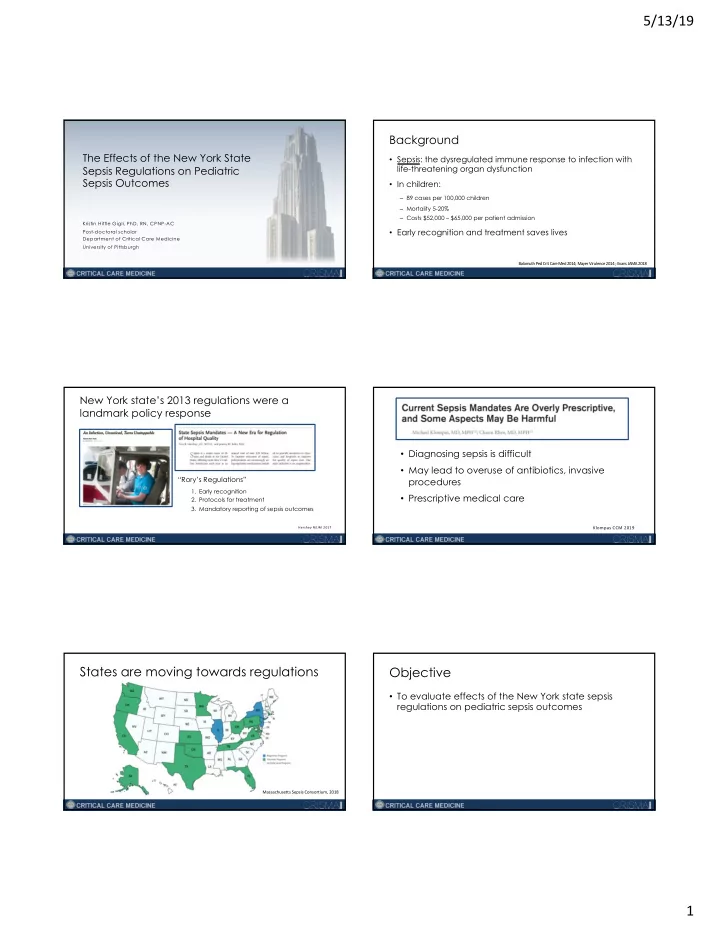
States are moving towards regulations Objective • To evaluate effects of the New York state sepsis regulations on pediatric sepsis outcomes Massachusetts Sepsis Consortium, 2018 1

  2. 5/13/19 Interrupted Time Series Methods • Longitudinal retrospective cohort study • Comparative interrupted time series design – 2011 to 2015 – New York compared to 4 control states • Florida, Massachusetts, Maryland, New Jersey • HCUP State Inpatient Database Comparative Interrupted Time Series Difference-in-Differences Control Group Effects of a policy intervention are Treatment Group estimated in a treatment group compared with a control group not affected by the policy of interest Pre Post Allows different slopes Level change Slope change Patient-level Regression Model Children <18 years old hospitalized with sepsis using Patients validated administrative codes, excluding live births Patient Covariates Hospital Covariates Age, gender, race Patient Volume Seasonality General acute-care hospitals in the five states Organ failure present on admission Teaching Status Matched on: pediatric volume Hospitals Presence of complex chronic conditions Geographic region population Clustered by hospital academic status region size Admission source Primary: In-hospital mortality Secondary: ICU admission rates Outcomes Hospital length of stay Central venous catheter rates C. Difficile infection rates 2

  3. 5/13/19 237 hospitals treated children with sepsis All analyses pre-specified and pre-published New York Control States Characteristic P-value (n=83) (n=154) Hospital Type General hospital, small pediatric volume 7 (8.4) 17 (11.0) 0.03 General hospital, medium pediatric volume 49 (59.0) 99 (64.3) General hospital, large pediatric volume 15 (18.1) 10 (6.5) Specialized children’s hospital 12 (14.5) 28 (18.2) Metropolitan statistical area size < 100,000 people 7 (8.4) 5 (3.3) 0.19 100,000 – 1 million people 18 (21.7) 40 (26.0) >1 million people 58 (69.9) 109 (70.8) Teaching Status 0.03 Non-teaching 21 (25.3) 60 (39.0) Teaching 62 (74.7) 94 (61.0) Miguel Science 2014; Thomas JAMA 2012; Kahn osf.io/76u3x 2018 9,436 patients in final analysis Overall pediatric sepsis mortality is decreasing New York Control 2 5 Unadjusted 30-day in-hospital mortality (%) January 2011 Pre Post Pre Post Characteristics NY: 14.1% 2 0 (N = 1,628) (N = 2,336) (N = 2,473) (N = 2,999) Control: 14.6% Age (years) 6.2 (6.3) 6.6 (6.1) 6.4 (6.3) 6.6 (6.2) 1 5 Gender (male) 52.1% 53.3% 55.2% 52.6% Admitted through ED 54.3% 62.2% 56.3% 62.3% 1 0 Complex Chronic Conditions: September 2015 None 23.5% 25.9% 24.1% 23.7% 5 NY: 8.7% One 25.3% 23.8% 23.5% 24.9% Control: 11.5% Two or more 51.3% 50.2% 52.4% 51.4% 0 -8 -7 -6 -5 -4 -3 -2 -1 0 1 2 3 4 5 6 7 8 9 1 0 Organ Failures on Admission Quarter Zero to two 92.4% 93.2% 93.6% 92.2% Two or more 7.6% 6.8% 6.4% 7.8% New Y or k st at e Co nt ro l st at es Pre-specified sensitivity analysis excluding hospitals in 2 5 Greater New York Hospital Association Risk-adjusted in-hospital mortality (%) ∆ ! t Adjusted 2 0 post-implementation trends Difference in pre-post quarterly change: -0.96% 1 5 (95% C.I.: -1.95 - 0.02) Overall test of 1 0 significance: 0.06 Change in Differential Adjusted pre-implementation ∆ ! Study group N quarterly trend change P-value " trends % (95% CI) % (95% CI) 5 No significant impact on - β = ∆ ! t ∆ ! c risk-adjusted mortality. -1.90 New York 1,335 (-3.48 – -0.31) -2.08 0.02 0 (-3.79 - -0.37) -8 -7 -6 -5 -4 -3 -2 -1 0 1 2 3 4 5 6 7 8 9 1 0 0.18 Control 3,495 Quarter (-0.37 – 0.73) New Yor k stat e Cont rol states 3

  4. 5/13/19 No Unintended Consequences Secondary outcomes Change in Differential change Study group Number P-value quarterly trend % (95% CI) % (95% CI) Central line ICU admission rates placement rates No Complex Chronic Conditions No effect (P=0.40) ICU Admissions Central Line Placement No effect (P=0.19) 80 Risk-Adjusted ICU Admission Risk-Adjusted CVL Placement 60 -1.02 78 New York 988 76 55 (-2.01 – -0.04) -1.36 74 50 0.04 Rates, % 72 Rate, % 45 (-2.62 - -0.09) 0.33 70 Control 1,306 40 68 (-0.50 – 1.16) 66 35 64 30 Directly Admitted - 8 - 6 - 4 - 2 0 2 4 6 8 10 - 8 - 6 - 4 - 2 0 2 4 6 8 10 Quarter Quarter -1.83 Con t r ol Ne w Yor k Con t r ol Ne w Yor k New York 1,627 (-3.13 - -0.52) -2.42 Length of Stay C. Difficile Infections 0.01 0.60 (-4.23 - -0.61) 30 8 Risk-Adjusted, No. Days Control 2,211 Risk-Adjusted C. Diff Infection 28 (-0.69 – 1.88) 6 26 Teaching Hospital 4 Rates, % 24 -8.39 22 2 New York 3,934 20 0 (-15.26 - -1.52) -7.10 - 8 - 6 - 4 - 2 0 2 4 6 8 10 - 8 - 6 - 4 - 2 0 2 4 6 8 10 0.05 Length of stay Quarter Quarter -1.30 (-14.04 – 0.15) C. Difficile Controls 5,307 No effect (P=0.18) infection rates Con t r ol Ne w Yor k Con t r ol Ne w Yor k (-3.28 – 0.69) No effect (P=0.15) Limitations Conclusions • Administrative data Implementation of state-wide sepsis regulation • did not improve sepsis mortality trends, • No data on functional outcomes or post-discharge except in subpopulations of pediatric patients survival There was no evidence of adverse consequences • • Results may be sensitive to choice of control states • Pediatric sepsis deaths are rare: live-saving effects may not be measurable at the population level Policy Implications Acknowledgements • Billie Davis, PhD, • Funding from: • Refinement of state-wide sepsis care policies are • Jonathan Yabes, PhD, – Agency for Healthcare needed to positively influence outcomes for all Chung-Chou Chang, PhD, • Research and Quality pediatric patients with sepsis Derek Angus, MD, MPH, (R01HS025146) • – National Institutes of Health Grant Martsolf, PhD, MPH, RN • (T32HL007820) • Need to understand mechanisms that lead to Tina Hershey, JD, MPH, • David Chong, MD • improvements in sepsis outcomes among the Jeremy Kahn, MD MS • subpopulations 4

  5. 5/13/19 Visit us at www.ccm.pitt/edu/crisma 5

Download Presentation
Download Policy: The content available on the website is offered to you 'AS IS' for your personal information and use only. It cannot be commercialized, licensed, or distributed on other websites without prior consent from the author. To download a presentation, simply click this link. If you encounter any difficulties during the download process, it's possible that the publisher has removed the file from their server.

Recommend


More recommend