Mortality Data for Pasco County, 2015 Florida Department of Health - - PDF document

mortality data for pasco county 2015
SMART_READER_LITE
LIVE PREVIEW

Mortality Data for Pasco County, 2015 Florida Department of Health - - PDF document

10/24/2016 Mortality Data for Pasco County, 2015 Florida Department of Health in Pasco County By Laike Abebe 10/19/2016 Background Population Data Pasco County, 2015 Total population 492,513 White 380,108 Black


slide-1
SLIDE 1

10/24/2016 1

Mortality Data for Pasco County, 2015

Florida Department of Health in Pasco County By Laike Abebe 10/19/2016

Background

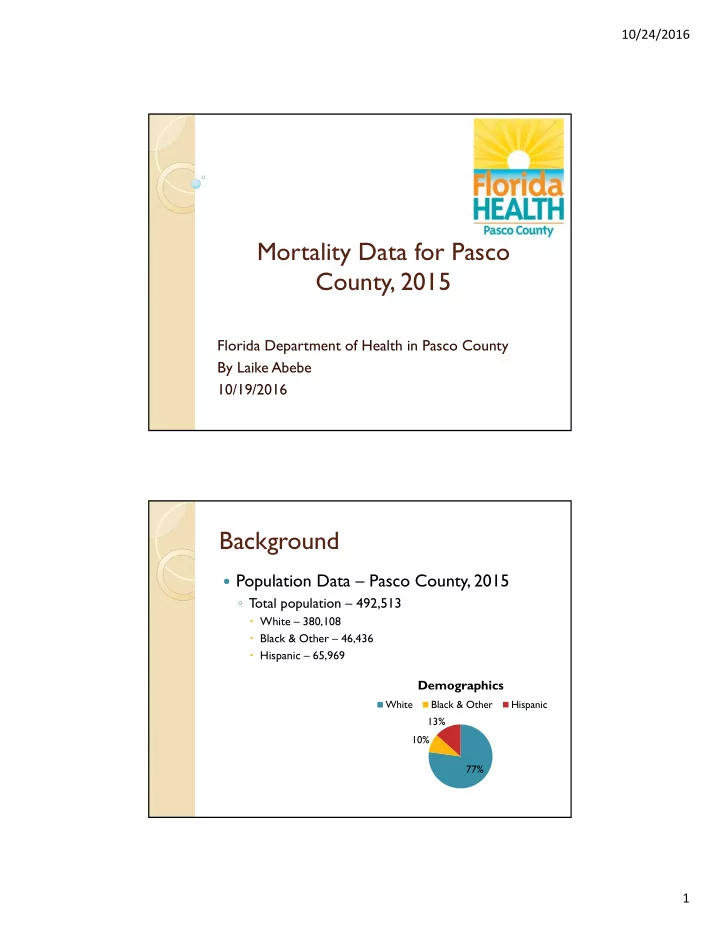
 Population Data – Pasco County, 2015

  • Total population – 492,513

 White – 380,108  Black & Other – 46,436  Hispanic – 65,969

77% 10% 13%

Demographics

White Black & Other Hispanic

slide-2
SLIDE 2

10/24/2016 2

Background

 Population Data – State of Florida, 2015

  • Total population – 19,860,805

 White -11,036,892  Black & Other – 3,969,530  Hispanic – 4,854,383

56% 20% 24%

Demographics

White Black & Other Hispanic

T

  • p 10 Causes of Death:

Pasco v. State of Florida (2015)

 Pasco County fares better than state average

in 4 out 10 leading causes of death:

 Cancer  Heart Diseases  Stroke  Alzheimer’s Disease

  • Cancer & heart diseases mortality trending

relative to state average

  • Stroke mortality decreased significantly from

previous year (5.8% to 5.0%)

slide-3
SLIDE 3

10/24/2016 3

T

  • p 10 Causes of Death:

Pasco v. State of Florida (2015) cont’d

 Pasco County fares worse than state average

in 6 out 10 leading causes of death:

 Chronic Lower Respiratory Disease (CLRD)  Unintentional Injury  Diabetes Mellitus  Kidney Disease  Chronic Liver Disease & Cirrhosis  Suicide

  • CLRD mortality is significantly higher than state

average and trending

  • Diabetes mortality also moderately higher than

state average

T

  • p 10 Causes of Death:

Pasco v. State of Florida (2015) cont’d

Overall Percentage and Number of T

  • tal Deaths in

Pasco County Overall Percentage and Number of T

  • tal Deaths in

Florida

Malignant Neoplasm 22.7% (n =1,338) 22.9% (n = 43,877) Heart Diseases 21.7% (n = 1,278) 23.6% (n = 45,199) CLRD 8.4% (n = 492) 6.1% (n =11,685) Unintentional Injury 5.5% (n = 326) 5.4% (n =10,346) Stroke 5.0% (n = 295) 6.0% (n = 11,410) Alzheimer’s Disease 3.4% (n =199) 3.7% (n = 7,021) Diabetes Mellitus 3.4% (n =199) 2.8% (n = 5,394) Kidney Disease 1.9% (n = 113) 1.7% (n = 3,194) Chronic Liver Dis. 1.9% (n = 111) 1.6% (n = 3,075) Suicide 1.7% (n = 103) 1.6% (n = 3,152)

slide-4
SLIDE 4

10/24/2016 4

Mortality Distribution: Age 0-4

 28 total deaths in Pasco County (2015)

  • Leading cause of death – Perinatal period

conditions

  • Deaths due to perinatal period conditions are

comparable to state average

  • Small sample size leads to high variability when

comparing to statewide levels of mortality

T

  • p 9 Causes of Death: Pasco v. State of

Florida (2015) – Age 0-4 Cohort

Percentage and Number of Deaths Among age 0-4 cohort in Pasco County, FL Percentage and Number of Deaths Among age 0-4 cohort in State of Florida

Perinatal Period Conditions 46.4% (n = 13) 45.6% (n = 759) Unintentional Injuries 21.4% (n = 6) 12.0% (n = 199) Congenital malformations 10.7% (n = 3) 17.1% (n = 286) Heart diseases 3.6% (n = 1) 1.4% (n = 24) Homicide 3.6% (n = 1) 2.0% (n = 33) Influenza & pneumonia 3.6% (n = 1) 0.6% (n = 10) Meningitis 3.6% (n = 1) 0.3% (n = 6) Kidney disease 3.6% (n = 1) 0.4% (n = 8) Septicemia 3.6% (n = 1) 1.0% (n = 18)

slide-5
SLIDE 5

10/24/2016 5

Mortality Distribution: Age 5-18

 25 total deaths in Pasco County (2015)

  • Leading cause of death – Unintentional injuries
  • Deaths due to unintentional injuries in Pasco

County are slightly better than state average

  • Similar issues with age 0-4 cohort regarding small

sample size

T

  • p 8 Causes of Death: Pasco v. State of

Florida (2015) – Age 5-18 Cohort

Percentage and Number of Deaths Among age 5-18 cohort in Pasco County, FL Percentage and Number of Deaths Among age 5-18 cohort in State of Florida

Unintentional Injuries 32.0% (n = 8) 35.0% (n = 253) Malignant Neoplasms 16.0% (n = 4) 10.9% (n = 79) Homicide 12.0% (n = 3) 13.2% (n = 95) Suicide 12.0% (n = 3) 11.2% (n = 81) Heart Diseases 8.0% (n = 2) 3.0% (n = 22) CLRD 4.0% (n = 1) 1.5% (n = 11) Congenital Malformations 4.0% (n = 1) 3.6% (n = 26) Other 12.0% (n = 3) N/A

slide-6
SLIDE 6

10/24/2016 6

Mortality Distribution: Age 19-64

 1,401 total deaths in Pasco County (2015)

  • Leading cause of death – Malignant neoplasm
  • Deaths due to malignant neoplasm in Pasco County

for this cohort are slightly higher than state average

  • Deaths due to CLRD, diabetes mellitus, and chronic

liver disease & cirrhosis in Pasco County are also higher than state average

  • Pasco County has higher than average rates of adult

smoking, adult obesity, physical inactivity, and excessive drinking which may correlate between

  • bserved differences at the county & state level

T

  • p 10 Causes of Death: Pasco v. State of

Florida (2015) – Age 19-64 Cohort

Percentage and Number of Deaths Among age 19-64 cohort in Pasco County, FL Percentage and Number of Deaths Among age 19-64 cohort in State of Florida

Malignant Neoplasm 26.9% (n = 377) 26.6% (n = 11,871) Heart Diseases 15.9% (n = 223) 16.9% (n = 7,548) Unintentional Injury 13.8% (n = 194) 13.2% (n = 5,872) CLRD 5.8% (n = 81) 3.5% (n = 1,573) Chronic Liver Disease & Cirrhosis 5.0% (n = 70) 4.3% (n = 1,918) Suicide 4.9% (n = 69) 5.1% (n = 2,264) Diabetes Mellitus 4.6% (n = 64) 3.3% (n = 1,481) Cerebrovascular Disease 2.0% (n = 28) 3.0% (n =1,331) Septicemia 1.8% (n = 25) 1.2% (n = 529) Homicide 1.3% (n = 18) 2.2% (n = 973)

slide-7
SLIDE 7

10/24/2016 7

Mortality Distribution: Age 65+

 4,487 total deaths in Pasco County (2015)

  • Leading cause of death – Heart diseases
  • Deaths due to heart diseases in Pasco County for this

cohort are lower than state average

  • Health behavior rankings (relating to rates of smoking,
  • besity, physical inactivity) have been decreasing

steadily for Pasco County over previous 5 years, from a high of 14th out of 67 counties in 2011 to 46th out

  • f 67 in 2015 so increase in heart diseases mortality

may be on the horizon

  • Deaths due to CLRD, diabetes mellitus, and kidney

diseases are higher than state average

T

  • p 10 Causes of Death: Pasco v. State of

Florida (2015) – Age 65+ Cohort

Percentage and Number of Deaths Among age 19-64 cohort in Pasco County, FL Percentage and Number of Deaths Among age 19-64 cohort in State of Florida

Heart Diseases 23.7% (n = 1,052) 26.0% (n = 37,603) Malignant Neoplasms 21.6% (n = 957) 22.1% (n = 31,899) CLRD 9.2% (n = 410) 7.0% (n = 10,099) Stroke 6.0% (n = 267) 7.0% (n = 10,063) Alzheimer’s Disease 4.5% (n = 198) 4.8% (n = 6,955) Diabetes Mellitus 3.0% (n = 135) 2.7% (n = 3,905) Unintentional Injuries 2.7% (n = 118) 2.8% (n = 4,020) Kidney Disease 2.2% (n = 99) 1.8% (n = 2,597)

  • Essen. Hypertension/

Renal Disease 1.4% (n = 61) 1.2% (n = 1,772) Influenza & Pneumonia 1.3% (n = 57) 1.6% (n = 2,263)

slide-8
SLIDE 8

10/24/2016 8

Age-Adjusted Death Rates

 All causes age-adjusted death rate (AADR)

for Pasco County

  • 765.7 per 100,000 (2015)
  • 3-year rolling rate: 765.4 per 100,000 (2013-

2015)

 All causes AADR for State of Florida in

2015:

  • 679.8 per 100,000 (2015)
  • 3-year rolling rate: 680.8 per 100,000 (2013-

2015)

Age-Adjusted Death Rates

Single Year (2015) Rolling 3-year (2013-2015)

slide-9
SLIDE 9

10/24/2016 9

Age-Adjusted Death Rates

 There are significant racial and gender

differences in all-cause and cause-specific AADR

  • Gender

 All causes AADR, Pasco County, men (2013-15):

 913.4 per 100,000 (Florida AADR for men – 811.5 per 100,000)

 All causes AADR, Pasco County, women (2013-15):

 636.7 per 100,000 (Florida AADR for women – 567.8 per 100,000)

Age-Adjusted Death Rates - Gender

slide-10
SLIDE 10

10/24/2016 10

Age Adjusted Death Rates - Gender

 In Pasco County males:

  • AADR for CLRD, diabetes mellitus, and

unintentional injury are trending slightly upward

  • AADR of cancer dropped from 214.3 per

100,000 to 208.6 in 2013, has remained relatively stable since then

  • AADR of heart diseases has also been relatively

stable since 2012

  • Pasco County men have AADR above state

average for every cause of death except HIV/AIDS (2012-2015)

Age-Adjusted Death Rate: Causes of Interest (Males)

50 100 150 200 250 2012 2013 2014 2015

slide-11
SLIDE 11

10/24/2016 11

Age-Adjusted Death Rates - Gender

 In females:

  • AADR of cancer dropped from 153.0 per

100,000 to 146.3 per 100,000 in 2014, has remained stable in 2015

  • AADR of heart diseases has steadily increased

from 2012 – 2014, dropped to 2013 levels last year

  • AADR of stroke increased consistently from

2012-2014, dropped below 2012 levels last year

  • Pasco County women have AADR above state

average for every cause of death except heart disease (2012, 2013, 2015) and stroke (2015)

Age-Adjusted Death Rate: Causes of Interest (Females)

20 40 60 80 100 120 140 160 180 2012 2013 2014 2015

slide-12
SLIDE 12

10/24/2016 12

Age-Adjusted Death Rates - Race

  • Race

 All causes AADR, Pasco County, white (2013-15):  775.1 per 100,000 (Florida AADR for whites – 674.1 per 100,000)  All causes AADR, Pasco County, black & other (2013-15):  592.7 per 100,000 (Florida AADR for black &

  • ther – 682.9 per 100,000)

Age-Adjusted Death Rates - Race

slide-13
SLIDE 13

10/24/2016 13

Age-Adjusted Death Rates - Race

 Over the previous four years, there has been

an increase in mortality due to CLRD among whites (the effect is less visible in minority groups)

 Age-adjusted death rates for heart diseases

and cancer have risen among the minority population over the previous four years, rates among whites remain stable but are still the highest among the three groups

Age-Adjusted Death Rates - Race

 CLRD is a growing problem within Pasco

County, age-adjusted death rates are much higher than state average

  • Primarily among white population, Hispanics had

below-average AADR in 2014, once again above- average in 2015.

  • Opposite was true for black & other population

in 2014 and 2015 respectively

 Stroke, diabetes mellitus, and HIV/AIDS deaths

continue to disproportionately affect black &

  • ther population
slide-14
SLIDE 14

10/24/2016 14

Age-Adjusted Death Rates: Causes of Interest (Whites)

20 40 60 80 100 120 140 160 180 200 Single Year AADR (per 100,000) 2012 2013 2014 2015

Age-Adjusted Death Rates: Causes of Interest (Black & Other)

20 40 60 80 100 120 140 160 180 200 Single Year AADR (per 100,000) 2012 2013 2014 2015

slide-15
SLIDE 15

10/24/2016 15

Age-Adjusted Death Rates: Causes of Interest (Hispanic)

20 40 60 80 100 120 140 160 180 200 Single Year AADR (per 100,000) 2012 2013 2014 2015

Age-Adjusted Death Rates for Major Causes of Death, Pasco County, 2015

20 40 60 80 100 120 140 160 180 200 2015 AADR (per 100,000) White Black & Other Hispanic

slide-16
SLIDE 16

10/24/2016 16

Years of Potential Life Lost (YPLL)

 Years of Potential Life Lost (YPLL) is a

summary measure of premature mortality

 Increased emphasis on causes of mortality

that are more common at an earlier age

 Calculated by subtracting age at death from

75 for all deaths which occur by a particular cause in a specific county (Pasco), then summing values and calculating a rate per 100,000 population under the age of 75

YPLL – Pasco County vs. State of Florida

 All causes

YPLL-Under 75 (Pasco):

  • 2007-2009 – 9,728.4 per 100,000
  • 2010-2012 – 8,934.6 per 100,000
  • 2013-2015 – 8,950.0 per 100,000

 All causes

YPLL-Under 75 (Florida)

  • 2007-2009 – 7,839.9 per 100,000
  • 2010-2012 – 7,320.0 per 100,000
  • 2013-2015 – 7,374.5 per 100,000
slide-17
SLIDE 17

10/24/2016 17

YPLL – Pasco County vs. State of Florida

2000 4000 6000 8000 10000 2011 2012 2013 2014 2015 YPLL Pasco YPLL State

YPLL – T

  • p 10 Causes of Death: Pasco

County vs. State of Florida (2015)

YPLL-75 per 100,000 for Pasco County YPLL-75 per 100,000 for State of Florida

Malignant Neoplasms 2,142.0 1,652.5 Heart Diseases 1,324.5 1,070.6 CLRD 480.9 228.7 Unintentional Injury 1,536.6 1,251.4 Stroke 163.2 195.5 Alzheimer’s Disease 10.4 13.4 Diabetes Mellitus 358.5 207.3 Kidney Disease 107.8 87.5 Chronic Liver Disease & Cirrhosis 345.4 239.1 Suicide 516.1 424.5

slide-18
SLIDE 18

10/24/2016 18

Conclusion

 In terms of overall mortality, Pasco County

performs better than state average in the top 2 leading causes of death but worse in regards to YPLL

  • Proportionally, fewer are dying but they are dying

at younger ages

  • Focusing on modifiable risk factors (tobacco use,

diet, hypertension, physical activity) will likely decrease YPLL in Pasco County

Conclusion

 CLRD mortality will likely continue to be

a problem for the county

  • Adult smoking rates compare unfavorably

with state averages (24% vs. 16.8% statewide)

  • Decreasing smoking prevalence may improve

CLRD mortality (along with other related diseases)

slide-19
SLIDE 19

10/24/2016 19

Conclusion

 Pasco County performs worse than state

averages in regards to (2015 data):

  • People reporting poor or fair health - 19% to 16%
  • Self-reported days of poor physical health in previous

30 days: 4.6 days vs. 3.7 days

  • Self-reported days of poor mental health in previous

30 days: 4.9 days vs. 3.8 days

  • Adult smoking: 24% vs. 16.8% (2013 BRFSS data)
  • Adult obesity: 29% vs. 26%
  • Physical inactivity: 28% vs. 23%
  • Excessive drinking: 20% vs. 16%

Conclusion

 There is opportunity through community

partnership and program implementation/expansion to reduce mortality caused by the effects of modifiable risk factors

slide-20
SLIDE 20

10/24/2016 20

References

 Florida Death Rate Query System. (2016, October 18). Retrieved

October 18, 2016, from http://www.floridacharts.com/FLQUERY/Death/DeathRate.aspx

 Cohen, A.,

Yu, B., Jiang, W., & Cui, D. (2014, May 14). Florida Behavioral Risk Factor Surveillance System (BRFSS) 2013 Data. Retrieved October 18, 2016, from http://www.floridahealth.gov/statistics-and-data/survey- data/behavioral-risk-factor-surveillance- system/reports/_documents/2013county/_documents/Pasco.pdf

 Age-Adjusted Rate Definition (n.d.). Retrieved October 18, 2016,

from http://health.mo.gov/data/mica/CDP_MICA/AARate.html

Questions?