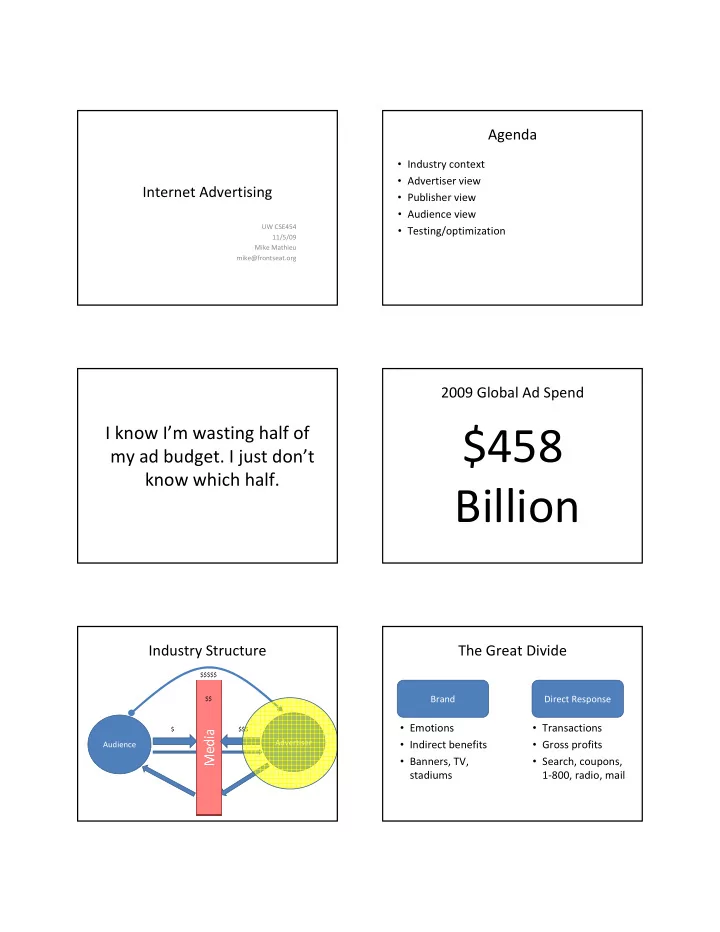
$458 my ad budget. I just dont know which half. Billion Industry - - PDF document

458
SMART_READER_LITE
LIVE PREVIEW

$458 my ad budget. I just dont know which half. Billion Industry - - PDF document

Agenda Industry context Advertiser view Internet Advertising Publisher view Audience view UW CSE454 Testing/optimization 11/5/09 Mike Mathieu mike@frontseat.org 2009 Global Ad Spend I know Im wasting half of $458 my ad


slide-1
SLIDE 1

Internet Advertising

UW CSE454 11/5/09 Mike Mathieu mike@frontseat.org

Agenda

  • Industry context
  • Advertiser view
  • Publisher view
  • Audience view
  • Testing/optimization

I know I’m wasting half of my ad budget. I just don’t know which half.

2009 Global Ad Spend

$458 Billion

Ad

Industry Structure

Advertiser Audience

$ $$$ $$$$$ $$

The Great Divide

Brand Direct Response

  • Emotions
  • Indirect benefits
  • Banners, TV,

stadiums

  • Transactions
  • Gross profits
  • Search, coupons,

1‐800, radio, mail

slide-2
SLIDE 2
  • Conversion Funnel

Ad Impressions Clicks Conversions Revenue

Monetizing Traffic

Search‐Paid Search‐Free Affiliates Display Ads Syndication Email Offline

LANDING PAGES $ per Transaction Conversion Rate TRAFFIC CTR CR x CPA = RPV Gross Margin

Share of Voice Costs $$$

0% Cost Per Action Reach 100%

0.00% 10.00% 20.00% 30.00% 40.00% 50.00% 60.00% 70.00% 80.00% 90.00% 100.00% 1 2 3 4 5 6 7 8 9 10 Search Rank Relative Conversion/ Traffic Potential $0.00 $1.00 $2.00 $3.00 $4.00 $5.00 $6.00 $7.00 $8.00 $9.00 Cost per Click

Conversion Potential vs. Price

slide-3
SLIDE 3

Real World Example Real World Example

Impressions

4.4M

Clicks

2078 CTR=0.0469% CPC=$0.65 eCPM=$0.31 CPRegClick=$19.69 CPReg=$46.76 69

RegClick Registrations

29

  • RefSrc on URL
  • Drop cookie
  • Pass RefSrc upon conversion
  • Match with ad spend
  • Calculate CPA

Bid Management

Term Clicks CPC Pos CR Leads CPA AvgPrice Revenue Spend GM Nursing School 5,000 $1.00 1 5% 250 $20.00 $7.50 $1,875 $5,000 ‐63% Nursing Schools 5,000 $2.00 3 20% 1,000 $10.00 $30.00 $30,000 $10,000 200% Total 10,000 $1.50 2 12.5% 1,250 $12.00 $25.50 $31,875 $15,000 113% Optimized 8,000 $2.43 1 22% 1,760 $11.05 $30.00 $52,800 $19,440 172%

Bid Optimization

  • Find shape of the

volume, CR, and price curves as f(pos)

  • Linear programming to

maximize goal (e.g. LTV, gross profit, volume)

  • Challenges

– Sample size – Price changes – Seasonality

0.00% 10.00% 20.00% 30.00% 40.00% 50.00% 60.00% 70.00% 80.00% 90.00% 100.00% 1 2 3 4 5 6 7 8 9 10 Search Rank Relative Conversion/ Traffic Potential $0.00 $1.00 $2.00 $3.00 $4.00 $5.00 $6.00 $7.00 $8.00 $9.00 Cost per Click Overture ABS - Efficient Frontier $300 $400 $500 $600 $700 $800 $900 $1,000 $0 $100 $200 $300 $400 $500 Cost Revenue $400 $500 $600 Daily Profit Efficient Frontier Actual Daily Avg. Daily Profit

Ad

Industry Structure

Advertiser Audience

$ $$$ $$$$$ $$

Online Advertising Risks

Balance of Risk Publisher Advertiser

Cost Per Impression (CPM) Cost Per Click (CPC) Cost Per Action (CPA) Revenue Share Subscription / Sponsorship

slide-4
SLIDE 4

“Low‐CPM” Innovation (circa 2001)

  • CPC Marketplace Formation
  • Advertiser Growth

– Text‐based ads – Self‐serve ads – RPV optimization – Keyword suggestion

  • Increased Bids

– Max Bids – Keyword opacity

  • Click Volume

– Syndication – Text ad network – International

  • Better Matches

– Landing page analysis – Ad inhibition

RPV Optimization:

Problems with Sort by CPC

Example Term: "mba" Ad Title

  • Univ. of Phx: Online MBA Univ. of Washington MBA

Ad Body 100% online university. Fully accredited. Foster School of business. Top 30 ranked. CPC $10.00 $0.50 CTR 0.01% 4% Position #1 #10 RPV $0.0010 $0.0200

RPV Optimization

Sort by (CPC_Bid x CTR)

Keyword Opacity

Impr CTR Clicks CPC CR Leads CPA Spend Nursing School 100,000 5% 5,000 $1.00 5% 250 $20.00 $5,000 Nursing Schools 10,000 50% 5,000 $2.00 20% 1,000 $10.00 $10,000 Total 110,000 9% 10,000 $1.50 12.5% 1,250 $12.00 $15,000 MatchDriver 110,000 9% 10,000 $2.00 12.5% 1,250 $16.00 $20,000

Landing Page Analysis

What?? No “Christmas”

Landing Page Analysis

No “Christmas” here either!

slide-5
SLIDE 5

Ad

Industry Structure

Advertiser Audience

$ $$$ $$$$$ $$

End Users

Don’t bug me

Unless I like what you have to offer

Better Matching

  • Context detection

– GPS, location – App vs. content – Info seeker vs. transactor – Calendars/schedules/events – Social networks/status – Twitter ‐ now – Behavioral – esp. w/knowledge of specific site behaviors – Contextual

  • Privacy

– Google “AOL search data”

Context?

  • Flowers
  • Mentos gum
  • Trial Prep
  • Credit score
  • Cosmetics
  • Hampton Inns
  • WeightWatchers
  • Vacation Home Rentals
  • Home Depot
  • Web Hosting
  • WebMD
  • Colon Cleanse – Warning
  • My Teeth Aren’t Yellow
  • Classmates.com

TESTING

Testing

Search‐Paid Search‐Free Affiliates Display Ads Syndication Email Offline

LANDING PAGES $ per Transaction Conversion Rate TRAFFIC CTR CR x CPA = RPV Gross Margin

slide-6
SLIDE 6

0.00% 10.00% 20.00% 30.00% 40.00% 50.00% 60.00% 70.00% 80.00% 90.00% 100.00% 1 2 3 4 5 6 7 8 9 10 Search Rank Relative Conversion/ Traffic Potential $0.00 $1.00 $2.00 $3.00 $4.00 $5.00 $6.00 $7.00 $8.00 $9.00 Cost per Click

Testing Testing

Sort by (CPC_Bid x CTR)

Testing

Sample Size, margin of error, confidence x = Z(c/100)2r(100‐r) n = N x/((N‐1)E

2 + x)

E = Sqrt[(N ‐ n)x/n(N‐1)]

Sample Size Problems

  • So many ideas, so little to sample…

– Disproportionate advantage to scale

  • Multivariate testing

– Taguchi Method

  • Method for calculating signal‐to‐noise ratio of different

parameters in an experimental design

  • Allows optimization with A/B test of each cross‐product

Testing A/B Split Test

slide-7
SLIDE 7

Repetition Professional Photos

Before After

We observed an immediate 30% increase in conversion rates

Fact Sheet Design

Analytics Opportunities

  • Advertisers

– Low‐RPV – Minimize waste – 10x simplicity

  • Publishers / Search Engines / Ad Networks

– Scaling local, hyperlocal – Other value judgments than rank

  • Under‐monetized sites
  • Audience prediction
  • Duplicate detection

– Google’s path to lead gen – Advertiser behavioral tracking

slide-8
SLIDE 8

Further Reading

  • Sample size calculators

– www.ezsurvey.com/samplesize.html – www.surveysystem.com/sscalc.htm

  • Google Analytics – www.google.com/analytics
  • Taguchi Method commercial products/whitepapers

– www.vertster.com – www.omniture.com/en/products/conversion/testandtarget

  • Online marketing sites

– searchengineland.com – searchenginewatch.com – www.marketingsherpa.com – www.dmnews.com – www.imediaconnection.com – www.iab.net (industry group)