4 2 5 6 6 7 1 Overfitting Overfitting 2 Examples - - PDF document

4 2 5 6 6 7 1 overfitting overfitting 2 examples
SMART_READER_LITE
LIVE PREVIEW

4 2 5 6 6 7 1 Overfitting Overfitting 2 Examples - - PDF document

Last Time ML II Decision trees and how to build them What might Information Gain we learn from these Entropy examples? Next up: Elements of a Learning System What can go wrong? How do we know how it went? 1 2


slide-1
SLIDE 1

1

1

ML II

Last Time…

  • Decision trees and how to build them
  • Information Gain
  • Entropy
  • Next up:
  • Elements of a Learning System
  • What can go wrong?
  • How do we know how it went?

2

What might we learn from these examples?
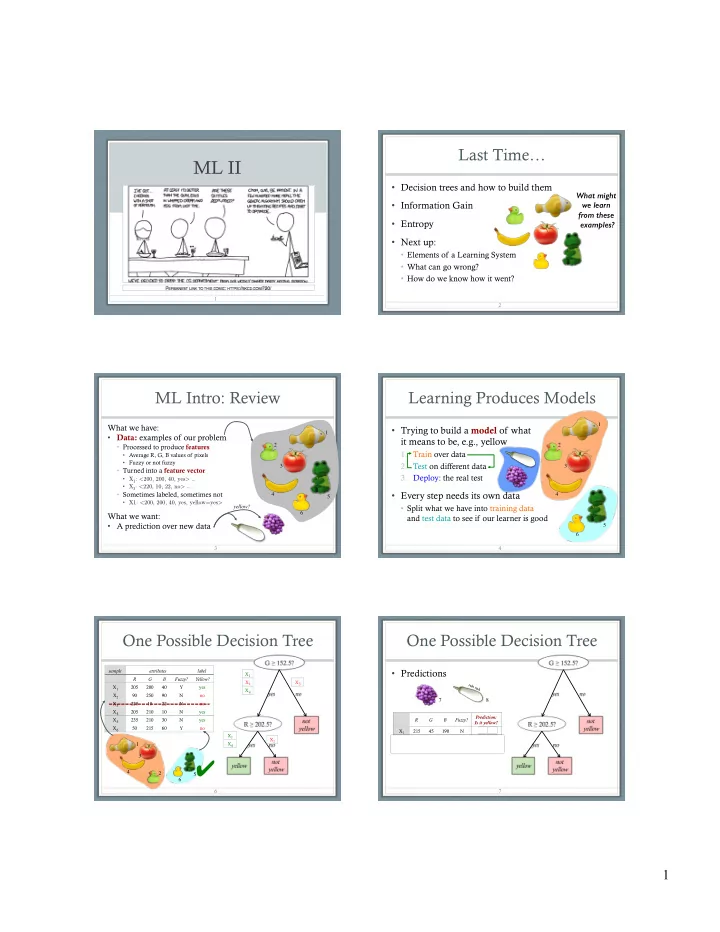
ML Intro: Review

What we have:

  • Data: examples of our problem
  • Processed to produce features
  • Average R, G, B values of pixels
  • Fuzzy or not fuzzy
  • Turned into a feature vector
  • X1: <200, 200, 40, yes> …
  • X3: <220, 10, 22, no> …
  • Sometimes labeled, sometimes not
  • X1: <200, 200, 40, yes, yellow=yes>

What we want:

  • A prediction over new data

3 1 2 3 4 5 6 yellow?

  • Trying to build a model of what

it means to be, e.g., yellow

  • 1. Train over data
  • 2. Test on different data
  • 3. Deploy: the real test
  • Every step needs its own data
  • Split what we have into training data

and test data to see if our learner is good

Learning Produces Models

4 1 2 3 4 5 6

One Possible Decision Tree

6

sample attributes label R G B Fuzzy? Yellow? X1 205 200 40 Y yes X2 90 250 90 N no X3 220 10 22 N no X4 205 210 10 N yes X5 235 210 30 N yes X6 50 215 60 Y no X1 X2 X4 X3 X2 X1 X4

5 6 1 2 3 4

One Possible Decision Tree

  • Predictions

7

R G B Fuzzy? Prediction: Is it yellow? X7 215 45 190 N no ✔ X8 220 240 225 N yes ✗

7 8

ruh roh

slide-2
SLIDE 2

2

Overfitting

8

  • Sometimes, model fits training data well but doesn’t

do well on test data

  • Can be it “overfit” to

the training data

  • Model is too specific

to training data

  • Doesn’t generalize to

new information well

  • Learned model: (Y∧Y∧YàB ∨ Y∧N∧NàM ∨ ...)

Examples (training data) Attributes Outcome Bipedal Flies Feathers Sparrow Y Y Y B Monkey Y N N M Ostrich Y N Y B Bat Y Y N M Elephant N N N M

Overfitting 2

  • Irrelevant attributes à
  • verfitting
  • If hypothesis space has

many dimensions (many attributes), may find meaningless regularity

  • Ex: Name starts with [A-M] à

Mammal

9

Examples (training data) Attributes Class Bi- pedal Feath- ers Sparrow Y Y B Monkey Y N M Ostrich Y Y B Bat Y N M Elephant N N M

  • Incomplete training

data à overfitting

  • Bad training/test

split à overfitting

Overfitting 3

10 5 6 1 2 3 4 5 6 1 2 3 4

Overfitting

  • Fix by by removing irrelevant features
  • E.g., remove ‘first letter’ from feature vector
  • Fix by getting more training data
  • Fix by pruning low nodes in the decision tree
  • E.g., if improvement from best attribute at a node is below

a threshold, stop and make this node a leaf rather than generating child nodes

  • Lots of other choices…

Noisy Data

  • Many kinds of “noise” can occur in the examples:
  • Two examples have same attribute/value pairs, but

different classifications

  • Some values of attributes are incorrect
  • Errors in the data acquisition process, the preprocessing phase, //
  • Classification is wrong (e.g., + instead of -) because of

some error

  • Some attributes are irrelevant to the decision-making

process, e.g., color of a die is irrelevant to its outcome

  • Some attributes are missing (are pangolins bipedal?)

12

Pruning Decision Trees

  • Replace a whole subtree by a leaf node
  • If: a decision rule establishes that he expected error rate in the subtree is

greater than in the single leaf. E.g.,

  • Training: one training red success and two training blue failures
  • Test: three red failures and one blue success
  • Consider replacing this subtree by a single Failure node. (leaf)
  • After replacement we will have only two errors instead of five:

Color

1 success 0 failure 0 success 2 failures red blue

Color

1 success 3 failure 1 success 1 failure red blue 2 success 4 failure

FAILURE

Training Test Pruned

13

slide-3
SLIDE 3

3

Summary: Decision Tree Learning

  • One of the most widely used learning methods in practice
  • Can out-perform human experts in many problems
  • Strengths include
  • Fast
  • Simple to implement
  • Can convert result to a set of easily interpretable rules
  • Empirically valid in many commercial products
  • Handles noisy data
  • Weaknesses:
  • Univariate splits/partitioning using only one attribute at a time

(limits types of possible trees)

  • Large decision trees may be hard to understand
  • Requires fixed-length feature vectors
  • Non-incremental (i.e., batch method)

14

Next Up

  • Evaluating a Learned Model
  • Elements of a Learning System

15

A Learning System

Four components of a machine learning system:

  • 1. Representation: how do we describe the problem

space?

  • 2. Actor: the part of the system that actually does

things

  • 3. Critic: Provides the experience we learn from
  • 4. Learner: the actual learning algorithm

Environment Agent Critic Learning Element Problem Generator Performer with KB Performance Standard Sensors Effectors feedback learning goals changes knowledge

General Model of Learning Agents

Representing The Problem

  • Representing the problem to be solved is the first

decision to be made (and most important)

  • Requires understanding the domain – the field in

which the problem is set

  • There are two aspects of representing a problem:
  • 1. Behavior that we want to learn
  • 2. Inputs we will learn from

Representation: Examples to think about

  • How do we describe a problem?
  • Guessing an animal?
  • Playing checkers?
  • Labeling spam email?
  • OCRing a check?
  • Noticing new help desk topics?
  • What data do you need to represent for each of

these? What model might you learn?

slide-4
SLIDE 4

4

Representation: Examples

  • Guessing an animal: a tree of questions and answers
  • Playing checkers: board, piece positions, rules; weights

for legal moves.

  • Labeling spam email: the frequencies of words used in

this email and in our entire mailbox; Naive Bayes.

  • OCRing: matrix of light/dark pixels; % light pixels; #

straight lines, etc.; neural net.

  • Noticing new help desk topics: Clustering algorithms

Actor

  • Want a system to do something.
  • Make a prediction
  • Sort into categories
  • Look for similarities
  • Once a model has been learned, we keep

using this piece

How Does the Actor Act?

  • Guessing an animal: walk the tree, ask the questions
  • Playing checkers: look through rules and weights to

identify a move

  • Identifying spam: examine the set of features,

calculate the probability of spam

  • OCRing a check: input the features for a digit,
  • utput probability for each of 0 through 9
  • Help desk topics: output a representation of clusters

Critic

  • Provides the experience we learn from
  • Typically a set of examples + action that should

be taken

  • But, can be any kind of feedback that indicates

how close we are to where we want to be

  • Feedback may be after one action, or a sequence

Critic: Think About

  • How do we judge correct actions?
  • Guessing an animal:
  • OCRing digits:
  • Identifying spam:
  • Playing checkers:
  • Grouping documents:

Critic: Possible Answers

  • How do we judge correct actions?
  • Guessing an animal: Human feedback.
  • OCRing digits: Human-categorized training set.
  • Identifying spam: Match to a set of human-categorized

test documents.

  • Playing checkers: Who won?
  • Grouping documents: Which are most similar in

language or content?

  • Can be generally categorized as supervised,

unsupervised, reinforcement.

slide-5
SLIDE 5

5

Learner

  • The learner is the core of a machine learning
  • system. It will:
  • Examine information provided by the critic
  • Modify the representation to improve performance
  • Repeat until performance is satisfactory, or until it stops

improving

  • The learner component is what people mean when

they talk about a machine learning algorithm

What Does the Learner Do?

  • Guessing an animal: ask user for a question, add it

to the binary tree

  • OCRing digits: modify importance of different

input features

  • Identifying spam: change words likely to be in spam
  • Playing checkers: increase chance of using some

rules, decrease the chance for others

  • Grouping documents: find clusters of similar

documents

Information Gain

  • Concept: make decisions that increase the

homogeneity of the data subsets (for outcomes)

  • Information gain is based on:
  • Decrease in entropy
  • After a dataset is split on an attribute.

à High homogeneity – e.g., likelihood samples will have the same class (outcome)

28

Extensions of the Decision Tree Learning Algorithm

  • Using gain ratios
  • Real-valued data
  • Noisy data and overfitting
  • Generation of rules
  • Setting parameters
  • Cross-validation for experimental validation of performance
  • C4.5 is an extension of ID3 that accounts for unavailable

values, continuous attribute value ranges, pruning of decision trees, rule derivation, and so on

29

Using Gain Ratios

  • Information gain favors attributes with a large number
  • f values
  • If we have an attribute D that has a distinct value for each

record, then Info(D,T) is 0, thus Gain(D,T) is maximal

  • To compensate, use the following ratio instead of Gain:

GainRatio(D,T) = Gain(D,T) / SplitInfo(D,T)

  • SplitInfo(D,T) is the information due to the split of T on

the basis of value of categorical attribute D

SplitInfo(D,T) = I(|T1|/|T|, |T2|/|T|, .., |Tm|/|T|)

where {T1, T2, .. Tm} is the partition of T induced by value

  • f D

30

Real-Valued Data

  • Select a set of thresholds defining intervals
  • Each interval becomes a discrete value of the attribute
  • How?
  • Use simple heuristics…
  • Always divide into quartiles
  • Use domain knowledge…
  • Divide age into infant (0-2), toddler (3 - 5), school-aged (5-8)
  • Or treat this as another learning problem
  • Try a range of ways to discretize the continuous variable and see

which yield “better results” w.r.t. some metric

  • E.g., try midpoint between every pair of values

31

slide-6
SLIDE 6

6

Measuring Model Quality

  • Training error
  • Train on all data; measure error on all data
  • Subject to overfitting (of course we’ll make good

predictions on the data on which we trained!)

  • Regularization
  • Attempt to avoid overfitting
  • Explicitly minimize the complexity of the function while

minimizing loss

  • Tradeoff is modeled with a regularization parameter

32

Measuring Model Quality

  • How good is a model?
  • Predictive accuracy
  • False positives / false negatives for a given cutoff threshold
  • Loss function (accounts for cost of different types of errors)
  • Area under the curve
  • Minimizing loss can lead to problems with overfitting

33

Cross-Validation

  • Holdout cross-validation:
  • Divide data into training set and test set
  • Train on training set; measure error on test set
  • Better than training error, since we are measuring

generalization to new data

  • To get a good estimate, we need a reasonably large test set
  • But this gives less data to train on, reducing our model

quality!

34

Cross-Validation, cont.

  • k-fold cross-validation:
  • Divide data into k folds
  • Train on k-1 folds, use the kth fold to measure error
  • Repeat k times; use average error to measure generalization

accuracy

  • Statistically valid and gives good accuracy estimates
  • Leave-one-out cross-validation (LOOCV)
  • k-fold cross validation where k=N (test data = 1 instance!)
  • Quite accurate, but also quite expensive, since it requires

building N models

35

Correctness

  • True positive
  • True negative
  • False positive
  • False negative

Precision/Recall

37