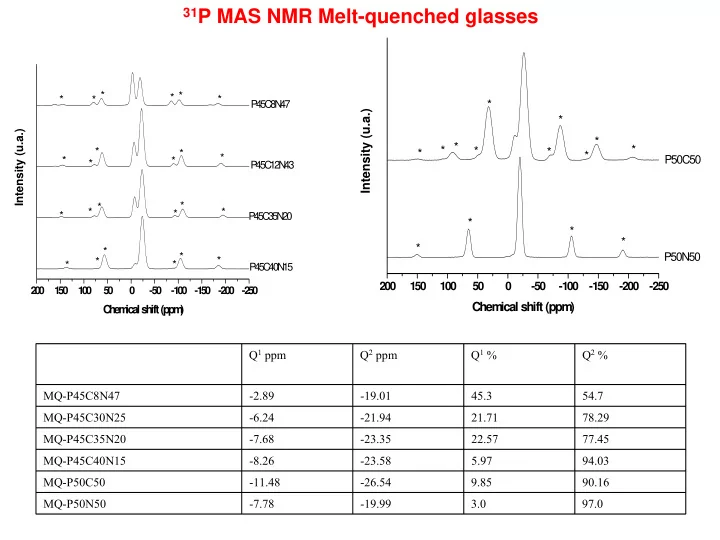
31 p mas nmr melt quenched glasses
play

31 P MAS NMR Melt-quenched glasses * * * * * * P 4 5C 8N - PowerPoint PPT Presentation

31 P MAS NMR Melt-quenched glasses * * * * * * P 4 5C 8N 47 * Intensity (u.a.) * Intensity (u.a.) * * * * * * * * * * * P50C50 * * * P 45C 12N 43 * * * * * * P 45 C 3 5N 20 * * * * * * P50N50 *


  1. 31 P MAS NMR Melt-quenched glasses * * * * * * P 4 5C 8N 47 * Intensity (u.a.) * Intensity (u.a.) * * * * * * * * * * * P50C50 * * * P 45C 12N 43 * * * * * * P 45 C 3 5N 20 * * * * * * P50N50 * * * * P 4 5C 40N 15 200 150 100 50 0 -50 -100 -150 -200 -250 2 0 0 1 5 0 1 0 0 5 0 0 -5 0 -1 0 0 -1 5 0 -2 0 0 -2 5 0 Chem ical shift (ppm ) C h e m ic a l s h ift (p p m ) Q 1 ppm Q 2 ppm Q 1 % Q 2 % MQ-P45C8N47 -2.89 -19.01 45.3 54.7 MQ-P45C30N25 -6.24 -21.94 21.71 78.29 MQ-P45C35N20 -7.68 -23.35 22.57 77.45 MQ-P45C40N15 -8.26 -23.58 5.97 94.03 MQ-P50C50 -11.48 -26.54 9.85 90.16 MQ-P50N50 -7.78 -19.99 3.0 97.0

  2. 31 P MAS NMR * * Intensity (u.a.) * * * * * Intensity (u.a.) * P 45C 30N 25 M Q * * * * P45C 28N 7K20; sol-gel * * * * * * P 45C 30N 25 S G * * P45C 28N 7K20 * * * * * * m elt-quenched * * * * P 45C 40N 15 S G 200 150 100 50 0 -50 -100 -150 -200 -250 2 0 0 1 5 0 1 0 0 5 0 0 -5 0 -1 0 0 -1 5 0 -2 0 0 -2 5 0 C hem ical shift (ppm ) C h e m ic a l s h ift (p p m ) Q 1 ppm Q 2 ppm Q 1 % Q 2 % SG- P45C28N7K20 -8.38 -22.7 19.35 80.65 SG- P45C30N25 -6.75 -21.94 24.0 76.0 SG-P45C40N15 -8.01 -23.93 23.37 76.63 -10.31 MQ-P45C30N25 -6.24 -21.94 21.71 78.29 MQ-P45C28N7K20 -7.70 -22.53 20.50 79.50

  3. Raman spectroscopy Melt-quenched glasses ν s(O-P-O) ν s (PO 2 ) ν (P-O) P 5 0 N 5 0 P 4 5 C 8 N 4 7 Intensity (a.u.) Intensity (a.u.) P 4 5 C 1 2 N 4 3 P 5 0 C 1 0 N 4 0 P 5 0 C 3 0 N 2 0 P 4 5 C 3 0 N 2 5 P 5 0 C 4 0 N 1 0 P 4 5 C 4 0 N 1 5 P 5 0 C 5 0 6 0 0 7 0 0 8 0 0 9 0 0 1 0 0 0 1 1 0 0 1 2 0 0 1 3 0 0 6 0 0 7 0 0 8 0 0 9 0 0 1 0 0 0 1 1 0 0 1 2 0 0 1 3 0 0 -1 ) -1 ) W a v e n u m b e r (c m W a v e n u m b e r (c m

  4. Infrared-spectroscopy-Melt-quenched glasses s (P-O-P) P 4 5 C 8 N 4 7 as (P-O-P) υ ) 2 ) - (P-O 3 as (PO PO 2 ) P 4 5 C 1 2 N 4 3 - P-O - s (PO Transmittance (a.u.) P-O δ υ υ υ P 4 5 C 3 5 N 2 0 P 4 5 C 4 0 N 1 5 6 0 0 8 0 0 1 0 0 0 1 2 0 0 - 1 ) W a v e n u m b e r ( c m

  5. Infra-red sol-gel with 25 mol % SiO 2 150 Si(Q6) P45C20N10S25 Intensity (u.a.) P45C30S25 120 90 600 1200 Wavenumber (cm-1)

  6. High-Energy XRD -Daresbury-Station 9.1 P50C50 MQ 3 P-O 2 Ca-O O-O 1 0 P-P -1 -2 -3 -4 -5 -6 0 0.5 1 1.5 2 2.5 3 3.5 4 4.5 5 R /Angs R/Å n δ P-O 1.54 3.5 0.085 Ca-O 2.39 4.2 0.1 O-O 2.51 4.5 0.15 P-P 2.98 4.75 0.2

  7. 31 P NMR • Ternary MQ: As the CaO increases and the Na2O decreases, the Q2 site fraction increases the Q1 decreases. • Binary MQ: P50C50 < Q2 than P50N50 • SG and MQ same compositions show similar Q distributions and chemical shifts Raman / IR • Q1 peak in Raman P45 with more than 43% Na2O • Shift to higher wavenumbers as CaO increases and Na2O decreases • Si(Q6) in sol-gel with 25 mol% SiO2 XRD P-O, Me-O distances and Ca 2+ coordination numbers are typical for methaphosphate glasses. Further exp work: 29 Si MAS NMR (Warwick January) 9.1 XRD (Daresbury February) Data analysis: Thermal Analysis Ca 2+ EXAFS High Energy XRD Papers: Comparison MQ and SG (Physics and Chemistry of glasses) (submitted) Synthesis (Journal of Materials Chemistry) (submitted) Vibrational spectroscopy (IR and Raman) 31 P MAS NMR (in progress)

  8. Sample Oxide Content (mol%) Nb 2 O 5 SiO 2 (Nb 2 O 5 ) 0.03 - (SiO 2 ) 0.97 unheated - - (Nb 2 O 5 ) 0.03 - (SiO 2 ) 0.97 250°C 3.8 96.2 (Nb 2 O 5 ) 0.03 - (SiO 2 ) 0.97 500°C 4.4 95.6 (Nb 2 O 5 ) 0.03 - (SiO 2 ) 0.97 750°C 3.8 96.2 (Nb 2 O 5 ) 0.30 - (SiO 2 ) 0.70 unheated 41.7 58.3 (Nb 2 O 5 ) 0.30 - (SiO 2 ) 0.70 250°C 39.1 60.9 (Nb 2 O 5 ) 0.30 - (SiO 2 ) 0.70 500°C 41.7 58.3 (Nb 2 O 5 ) 0.30 - (SiO 2 ) 0.70 750°C 41.7 58.3

  9. Si-O co-ordination too large! Nb3% 750C

  10. Si-O Si-O co-ordination more realistic Nb3% 750C Nb-O

  11. (Nb 2 O 5 ) 0.03 - (SiO 2 ) 0.97 Si-O Nb-Nb Si-Si O-O Nb-Si Nb-O

  12. (Nb 2 O 5 ) 0.075 - (SiO 2 ) 0.925 Si-O Nb-Nb Nb-O Si-Si Nb-Si O-O

  13. (Nb 2 O 5 ) 0.30 - (SiO 2 ) 0.70 Nb-O Nb-Nb Nb-Si Si-O Si-Si O-O

  14. X-Ray diffraction data showing the in-situ sol-gel reaction for (TiO 2 ) 0.3 -(SiO 2 ) 0.7

  15. X-Ray diffraction data showing the in-situ sol-gel reaction for (TiO2)0.3-(SiO2)0.7

  16. X-Ray diffraction data showing the in-situ sol-gel reaction for (TiO 2 ) 0.3 -(SiO 2 ) 0.7

  17. X-Ray diffraction data showing the in-situ heating of (TiO 2 ) 0.3 -(SiO 2 ) 0.7

  18. X-Ray diffraction data showing the in-situ heating of (TiO 2 ) 0.3 -(SiO 2 ) 0.7

  19. X-Ray diffraction data showing the in-situ heating of (TiO 2 ) 0.3 -(SiO 2 ) 0.7

  20. X-Ray diffraction data showing the in-situ heating of (TiO 2 ) 0.3 -(SiO 2 ) 0.7

  21. X-Ray diffraction data showing the in-situ heating of (TiO 2 ) 0.3 -(SiO 2 ) 0.7

  22. X-Ray diffraction data showing the in-situ heating of (TiO 2 ) 0.3 -(SiO 2 ) 0.7

  23. SAXS • 70:30 Powders (1 minute-30 days) • Ahmad’s powders • Thin films on a mica window • Un-reacted 70:30 Powder in SBF through a capillary, normal concentration of sample • Un-reacted 70:30 powder in SBF through a capillary, higher concentration of sample

  24. Results • Powders went fine, first peak changed and Bragg peaks occurred from 5hr sample • Thin films of sample on mica washed off but sample holder worked • No bragg peaks occurred in any of the capillary runs that could be seen, not even with greater amount of sample in SBF

  25. Future work • Films that are thicker or with more layers are being made by Ahmad (daresbury) • Capillary can be increased in diameter to 2mm to increase amount of sample in the beam (daresbury) • Solid piece of sample with SBF flowing over (ESRF)

  26. Neutron Data • Ta Si neutron data is now giving correct Si-O bond length • Once data is re-analysed it will be included in MPhys project student’s RMC modelling along with XRD data

  27. Turbidity • In house turbidity experiments on Calcium silicate glasses in-situ • Build an in-situ cell for UV-visible-NIR spectrophotometer

  28. Models: Model 00 Model 10 Model20 Model30 Model40 Model 50 g/cm3 1.99 2.11 2.22 2.37 2.50 2.67 box L ( Å) 25.72 25.19 24.67 24.11 23.62 23.08 box atm 1152 1120 1088 1056 1024 992 num Si 320 288 256 224 192 160 num Ca 0 32 64 96 128 160 num O total 704 672 640 608 576 544 O bO / O nb only 576 544 512 480 448 416 num H / O h 128 128 128 128 128 128 • Can have any density / composition • Density 90% of Bulk Glass • OH Content 40% of Ca+Si Value

  29. M10, x = 0.1 M50, x = 0.5

  30. M30 (x = 0.3)

  31. The distribution functions g(r) for Si-O total , Si-O b , Si- O nb Si-O h , Si-H and Si-Si (left hand axis) for M30 (x = 0.3) 30 Si-Ototal Si-Ob Si-Onb Si-Oh 25 Si-Si Si-H SiCa 20 g(r) 15 10 5 0 0 1 2 3 4 5 6 r(Angs)

  32. The Distribution Functions g(r) for Ca-O total , Ca-O b , Ca-O nb , Ca-O h and Ca-Ca (left hand axis) for M30 (x = 0.3) 7 1.2 Ca-OTotal 6 1 Ca-Ob 5 Ca-Onb 0.8 g(r) Ca-Ca 4 Ca-Oh g(r) 0.6 Ca-H 3 0.4 Ca-Ca 2 SiCa 0.2 1 0 0 0 1 2 3 4 5 6 r(Angs)

  33. Neutron Diffraction MD30 Difference v Neutron Isotope Difference Data Ca44 0.30 Neutron Isotope Data S(Q) Ca44 0.20 M30 S(Q) Ca44 (85% D) 0.10 S(Q) 0.00 0.0 2.0 4.0 6.0 8.0 10.0 12.0 14.0 16.0 18.0 20.0 -0.10 -0.20 -0.30 Q

  34. Silicon & Oxygen Coordination Si-(O total / O b&nb / O h ) ( O total / O b&nb / O h )- Si • Si – O total is 100% 4 coordinated • There is a growth of O nb as you add Ca. • O b - Si for M00 98% and M50 • Si - O b&nb 6% N=2, 32% N=3, 39%. 63% N=4. • O nb - Si M00 2% and M50 60% • Due to deploymerisation by the • Si – Oh 64% N=0, 30% N=1, 6% Ca. N=2. So 64% of Si has no O h coordination. • There is a preference for Oh to • The values don’t change much as go to Ca region. Ca is added (M00 – M50). • Initially M00 O h -Si is 96% N = 1, As Ca is added, M50 has 50% 0, 50% 1.

  35. Calcium & Oxygen Coordination • There are no N = 0 for Si- • Total Ca – O total changes O b/nb thus there are no from 4.5 to 6 as Ca is added. isolated O nb ’s in the Ca A similar trend to the bulk region. glass results for variation in Ca content. • By comparing ratios for avg. CN’s Si-O b/nb / Si-O h • The change in Ca and Ca-O b/nb / Ca-O h the Coordination is due to the former ratios are 4 times increase in O nb rather than greater than the latter. changes to the Ca-O h which Hence there is a preference remain steady as the Ca for more O’s in Si region content is altered. and more O h ’s in the Ca region.

  36. 1.8 1.6 1.4 1.2 1.0 0.8 0.6 s50 s60 0.4 s70 0.2 s80 0.0 -0.2 -0.4 0 1 2 3 4 5

  37. 2.0 1.5 1.0 0.5 s70 s70 - lorch function 0.0 0 1 2 3 4 5

  38. 2.0 s70 1.8 s70 sbf 1day 1.6 difference 1.4 1.2 1.0 0.8 0.6 0.4 0.2 0.0 -0.2 -0.4 -0.6 0 1 2 3 4 5

Download Presentation
Download Policy: The content available on the website is offered to you 'AS IS' for your personal information and use only. It cannot be commercialized, licensed, or distributed on other websites without prior consent from the author. To download a presentation, simply click this link. If you encounter any difficulties during the download process, it's possible that the publisher has removed the file from their server.

Recommend


More recommend