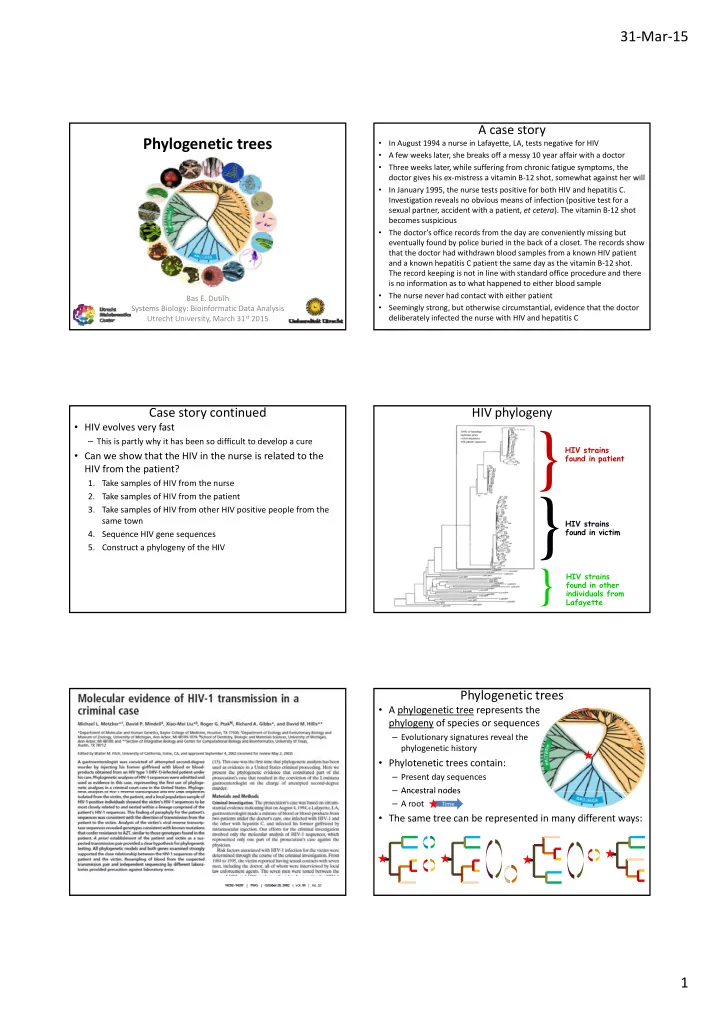
3 take samples of hiv from other hiv positive people from
play

} } 3. Take samples of HIV from other HIV positive people from the - PDF document

31 Mar 15 A case story Phylogenetic trees In August 1994 a nurse in Lafayette, LA, tests negative for HIV A few weeks later, she breaks off a messy 10 year affair with a doctor Three weeks later, while suffering from chronic


  1. 31 ‐ Mar ‐ 15 A case story Phylogenetic trees In August 1994 a nurse in Lafayette, LA, tests negative for HIV • A few weeks later, she breaks off a messy 10 year affair with a doctor • Three weeks later, while suffering from chronic fatigue symptoms, the • doctor gives his ex ‐ mistress a vitamin B ‐ 12 shot, somewhat against her will In January 1995, the nurse tests positive for both HIV and hepatitis C. • Investigation reveals no obvious means of infection (positive test for a sexual partner, accident with a patient, et cetera ). The vitamin B ‐ 12 shot becomes suspicious The doctor’s office records from the day are conveniently missing but • eventually found by police buried in the back of a closet. The records show that the doctor had withdrawn blood samples from a known HIV patient and a known hepatitis C patient the same day as the vitamin B ‐ 12 shot. The record keeping is not in line with standard office procedure and there is no information as to what happened to either blood sample The nurse never had contact with either patient Bas E. Dutilh • Systems Biology: Bioinformatic Data Analysis Seemingly strong, but otherwise circumstantial, evidence that the doctor • Utrecht University, March 31 st 2015 deliberately infected the nurse with HIV and hepatitis C Case story continued HIV phylogeny • HIV evolves very fast } – This is partly why it has been so difficult to develop a cure HIV strains • Can we show that the HIV in the nurse is related to the found in patient HIV from the patient? 1. Take samples of HIV from the nurse 2. Take samples of HIV from the patient } } 3. Take samples of HIV from other HIV positive people from the 3 Take samples of HIV from other HIV positive people from the same town HIV strains found in victim 4. Sequence HIV gene sequences 5. Construct a phylogeny of the HIV } HIV strains found in other individuals from Lafayette Phylogenetic trees • A phylogenetic tree represents the phylogeny of species or sequences – Evolutionary signatures reveal the phylogenetic history • Phylotenetic trees contain: – Present day sequences – Ancestral nodes Ancestral nodes – A root Time • The same tree can be represented in many different ways: 1

  2. 31 ‐ Mar ‐ 15 Ways of constructing phylogenetic trees • Distance ‐ based approaches – Among the fastest programs for making phylogenetic trees – Unweighted Pair Group Method with Arithmetic mean (UPGMA) – Neighbor Joining (NJ) Time • Maximum likelihood and maximum parsimony approaches Distance ‐ based approach Evolutionary distances • Sequence (dis ‐ )similarity represents evolutionary distance – Use similarity quantification methods from last week’s lectures Multiple sequence • But: evolutionary distance does not correlate 1:1 with alignment sequence alignment score – Because mutations at the same position in the sequence become Calculate evolutionary divergence increasingly likely Evolutionary 3 4    – So we have to correct for that: So we have to correct for that: d d ln( ( 1 D ) ) distance di t 4 3 Actual number of mutations matrix Cluster: UPGMA, Neighbor Joining Jukes Cantor correction Phylogenetic tree Observed number of mutated positions The molecular clock UPGMA example • The concept of a molecular • UPGMA is a greedy algorithm clock is based on the – This means that nodes with the smallest distances are joined first observation that the number of amino acid differences in hemoglobin between Human Mouse Chimp Worm Yeast different lineages changes Human ‐ 5 1 8 9 roughly linearly with time, as Mouse ‐ 4 10 11 estimated from fossil estimated from fossil Chimp Chimp ‐ 9 9 9 9 evidence Worm ‐ 2 • In reverse, this would allow Yeast ‐ us to estimate the dates of 1 Y evolutionary events from by H+C Mouse Worm Yeast 1 biological sequence analysis W H+C ‐ 4.5 8.5 9 0.5 H • The molecular clock holds in Mouse ‐ 10 11 0.5 C some cases Worm ‐ 2 Yeast ‐ 2

  3. 31 ‐ Mar ‐ 15 UPGMA example UPGMA example • UPGMA is a greedy algorithm • UPGMA is a greedy algorithm – This means that nodes with the smallest distances are joined first – This means that nodes with the smallest distances are joined first – The root is added last at the mid ‐ point Human Mouse Chimp Worm Yeast Human Mouse Chimp Worm Yeast Human ‐ 5 1 8 9 Human ‐ 5 1 8 9 Mouse ‐ 4 10 11 Mouse ‐ 4 10 11 Chimp Chimp ‐ 9 9 9 9 Chimp Chimp ‐ 9 9 9 9 Worm ‐ 2 Worm ‐ 2 Yeast ‐ Yeast ‐ 1 1 Y Y 3.67 H+C Mouse W+Y (H+C)+M W+Y 1 1 W W H+C ‐ 4.5 8.75 (H+C)+M ‐ 9.33 0.5 0.5 H H Mouse ‐ 10.5 1.75 W+Y ‐ 1.75 0.5 0.5 C 2.42 C W+Y ‐ 2.25 2.25 M M An exam question 2 A 1 B 0.5 1.5 D E C 1. Assume that the molecular clock holds. a) Fill in the missing branch lengths. b) What algorithm was used for building this phylogenetic tree? c) What are d AB and d CD ? d) Write this tree in Newick tree format with branch lengths. 2. Research has revealed that the molecular clock does not hold for the lineage leading to C. If d BC = 6, what is the distance between C and its last common ancestor with A, B, D, and E? Answers Answers 3.5 1.5 D C 2 1.5 A 1 1.5 1.5 2 D E 1.5 B 0.5 0.5 1.5 2 E A 1.5 0.5 D 1 1.5 2 2 1.5 B 1 B E 2 3.5 3.5 C A C 1. Assume that the molecular clock holds 1. The following bracket ‐ notations are also correct: a) See above d) (((A:2,B:2):1,(D:1.5,E:1.5):1.5):0.5),C:3.5); b) Unweighted Pair Group Method with Arithmetic mean (UPGMA) d) (C:3.5,((D:1.5,E:1.5):1.5,(B:2,A:2):1):0.5)); c) d AB = 4, d CD = 7 d) (C:3.5,((B:2,A:2):1,(D:1.5,E:1.5):1.5):0.5)); d) d) (((A:2,B:2):1,(D:1.5,E:1.5):1.5):0.5),C:3.5); (C:3.5,((A:2,B:2):1,(E:1.5,D:1.5):1.5):0.5)); 2. 2.5 Et cetera 3

  4. 31 ‐ Mar ‐ 15 Non ‐ uniform molecular clock Unequal rates of evolution are the rule • Greedy algorithms only work if the clock runs at the same speed in all branches – All distances to the root are equal – The tree is called ultrametric Protist mitochondrion Plant mitochondrion • This is often not the case: Species A (fast evolving) Species B (slow evolving) Species C (fast evolving) Species D (slow evolving) Now Now • Neighbor Joining (NJ) is designed to account for a non ‐ uniform molecular clock For detailed explanation check: youtu.be/B ‐ oHOoYvE6E Maximum parsimony (MP) and likelihood (ML) Maximum parsimony (MP) • MP example for a single position “alignment” in 5 species: • Maximum parsimony (MP): Chimpanzee C the tree that requires the Gibbon T Gorilla C fewest evolutionary events to Human C Orangutan T explain the alignment • Draw all possible trees for the sequences/species present in your multiple alignment – Occam’s razor: the simplest • For each tree, identify where the mutations have taken place explanation of the observations – Make parsimony assumption: minimum number of required mutations • Maximum likelihood (ML): the Maximum likelihood (ML): the tree most likely to have led to the alignment given a certain model of evolution Maximum parsimony (MP) Maximum likelihood (ML) • How many trees are there? • The simplest explanation is not always the most likely one = (2n ‐ 5) × (2n ‐ 7) × ... × 3 × 1 – # unrooted trees N U = (2n ‐ 5)!! – We know that some mutations are more likely than others = (2n ‐ 3) × (2n ‐ 5) × ... × 3 × 1 – # rooted trees N R = (2n ‐ 3)!! • Like MP, ML starts by drawing all possible trees • The MP tree has the minimum number of required • For each tree, ML then calculates how likely it is that this mutations tree gave rise to the observations (i.e. the alignment) – It is the simplest explanation of the alignment – This depends on assumptions made about evolutionary events – Informative positions contain at ≥ 2 different characters ≥ 2 × each Informative positions contain at ≥ 2 different characters ≥ 2 × each • Substitution matrix and gap penalties S b tit ti t i d lti • Faster/slower evolving positions in the sequence • Faster/slower evolving lineages in the tree – These assumptions are called the evolutionary model • The maximum likelihood tree is the tree that is most likely to have generated the observations (i.e. the multiple 1: c-t 7: a-t alignment) given the model 3: t-a 6: a-t 4

Download Presentation
Download Policy: The content available on the website is offered to you 'AS IS' for your personal information and use only. It cannot be commercialized, licensed, or distributed on other websites without prior consent from the author. To download a presentation, simply click this link. If you encounter any difficulties during the download process, it's possible that the publisher has removed the file from their server.

Recommend


More recommend