
SLIDE 1
3/9/2020 1
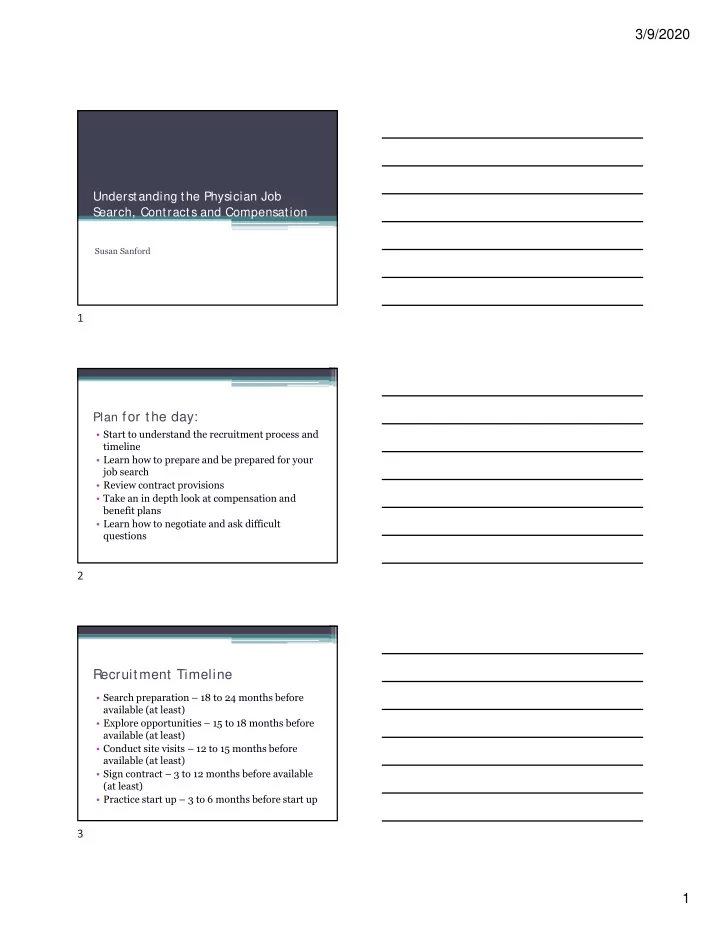
Understanding the Physician Job S earch, Contracts and Compensation
Susan Sanford
Plan for the day:
- Start to understand the recruitment process and
timeline
- Learn how to prepare and be prepared for your
job search
- Review contract provisions
- Take an in depth look at compensation and
benefit plans
- Learn how to negotiate and ask difficult
questions
Recruitment Timeline
- Search preparation – 18 to 24 months before
available (at least)
- Explore opportunities – 15 to 18 months before
available (at least)
- Conduct site visits – 12 to 15 months before
available (at least)
- Sign contract – 3 to 12 months before available
(at least)
- Practice start up – 3 to 6 months before start up