
SLIDE 1
2019 Preliminary Results
For the 52 weeks ended 28 December 2019
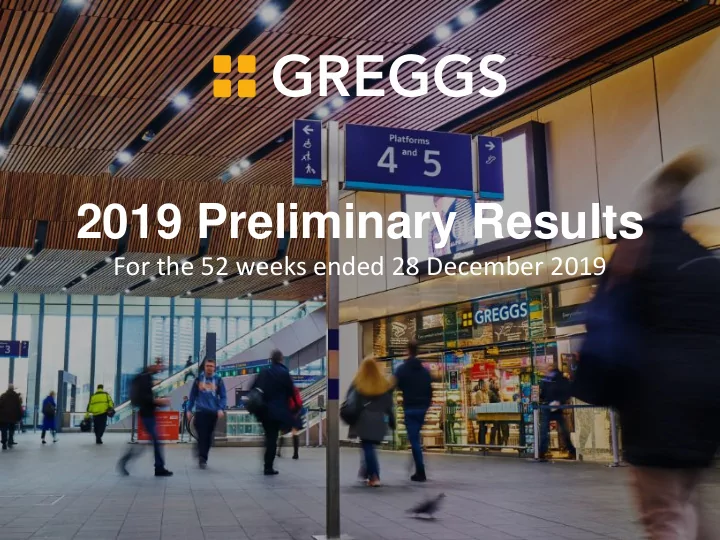
2019 Preliminary Results For the 52 weeks ended 28 December 2019 - - PowerPoint PPT Presentation
2019 Preliminary Results For the 52 weeks ended 28 December 2019 Agenda Highlights Financial performance Strategic progress Current trading & outlook 2 2019: A year of record-breaking performance Total sales up 13.5% to 1,167.9m
For the 52 weeks ended 28 December 2019
Highlights Financial performance Strategic progress Current trading & outlook
2
both employees and shareholders
* like-for-like sales in Company-managed shops (excluding franchises) with a calendar year’s trading history ** excluding exceptional pre-tax charge of £5.9m in 2019 (2018: £7.2m charge)
Total sales up
13.5%
to £1,167.9m Pre-tax profit
£114.2m**
Company-managed shop LFL sales up
9.2%
3
Richard Hutton
4
5
2019 figures reflect the adoption of IFRS16 (lease accounting) and are not directly comparable with 2018, which has not been
Exceptional charges relate to costs of previously-announced restructuring of supply chain operations * **
2019 £m 2018 £m Sales 1,167.9 1,029.3 +13.5% Operating profit before property & exceptional items* 120.0 89.1 Property disposal gains 0.7 0.7 EBIT before exceptionals* 120.7 89.8 Finance expense (inc. leases) (6.5) (0.0) PBT before exceptional items* 114.2 89.8 +27.2% Net exceptional charge** (5.9) (7.2) Profit before taxation* 108.3 82.6
0% 2% 4% 6% 8% 10% 12% Q1 17 Q2 17 Q3 17 Q4 17 Q1 18 Q2 18 Q3 18 Q4 18 Q1 19 Q2 19 Q3 19 Q4 19 Wks 1-9 2020
Quarterly Company-managed shop LFL sales growth
6
7.5% YTD Strong start in January, significant storm impact in February
(before exceptionals)
2019 2018
Sales £1,167.9m £1,029.3m Gross margin 64.7% 63.7% Distribution & selling costs (49.0)% (49.9)% Admin expenses (5.3)% (5.1)% EBIT (before exceptionals) £120.7m £89.8m Finance expense (£6.5m) (0.0m) PBT £114.2m £89.8m PBT margin 9.8% 8.7%
volume growth
lower than previous rental charge)
7
Exceptionally strong LFL growth plus estate expansion
£89.8m
* PBT excluding exceptional items in both years ** Like-for-like growth in company-managed shops, franchised shops, and wholesale sales
8
£114.2m £m
Exceptional charges almost complete
Expected charge through to 2020/21 broadly in line with previous guidance
9
£m 2016 2017 2018 2019 2020/1 Total Cash change costs 4.5 9.2 5.2 5.8 2.2 26.9 Non-cash (asset-related) charges 1.9 1.3 0.7 0.1 0.1 4.1 Exceptional P&L charge 6.4 10.5 5.9 5.9 2.3 31.0 Phasing of cash flow 3.8 1.9 9.0 9.1 3.1 26.9
10
Investment programme expected to complete in mid-2021, already delivering capacity for next phase of growth and efficiencies ahead of initial plan
0.0% 2.0% 4.0% 6.0% 8.0% 10.0% 12.0% 14.0% 16.0% 18.0% 20.0% 2013 2014 2015 2016 2017 2018 2019
Manufacturing & logistics cost as % of sales
related to removal of in-store bakeries
programme has now delivered further net supply efficiencies of £9.5m compared with the 2015 base (vs expected £7.0 million)
consistency already evident
Food & energy costs
inflation, weighted to H2
cost reduction.
food input inflation (including pork costs contribution 4-5%)
forward cover on food inputs and energy (currently at short end)
40% 8% 29% 4% 6% 13% People costs Shop occupancy Food & packaging Energy/fuel Depreciation Other
People costs
wage & salary inflation, inc. £3m additional for pensions
reflecting continued impact of National Living Wage increases
allergen labelling costs to start
Cost mitigation in 2020
non-recurrence of £10m one-off costs incurred in 2019)
Cost base
11
2019 2018
Tax charge*
19.6% 20.2% Underlying diluted earnings per share* 89.7p 70.3p +27.6% Underlying basic earnings per share* 91.0p 71.1p +28.0% Full year ordinary dividend per share 44.9p 35.7p +25.8% Special dividend per share 35.0p
Distribution approach
12
13
2020 Plan £m 2019 Actual £m 2018 Actual £m New shops and relocations (fitting & equipment) 21.0 18.6 19.4 Shop fitting – refurbishment 7.0 4.5 5.9 Shop equipment (additional and replacement) 14.0 12.9 7.8 Supply chain 51.0 42.2 32.9 I.T. and other 7.0 7.8 7.0 Total capital expenditure c.100.0 86.0 73.0 Number of gross new shops @ c.£200k* (incl. relocations, excl. franchises) c.100 93 87 Number of shop refits @ c.£80k^
* Shop fitting and equipment cost ^ Shop fitting cost only
c.90 57 89
14 20 40 60 80 100 2016 2017 2018 2019 2020 plan 2021 plan 2022 plan 2023 plan Retail IT & other Supply chain £m
New Company managed shops 88 86 87 93 c.100 c.100 c.100 c.100 Company managed refits 207 132 89 57 c.90 c.160 c.180 c.220
shops to increase as we come out of current low point in cycle
programme nearing completion, will invest in further manufacturing & logistics capacity to meet increased demand for best-selling products
requirement to be around £90 million per annum
15
less current liabilities. Also reduces PBT by an estimated £4.2m, as previously disclosed
reflecting strength of performance in the year relative to the capital base
Reporting affected by lease accounting adoption
* PBT (excluding exceptional items) divided by average total assets less current liabilities for the year
0% 5% 10% 15% 20% 25% 30% 35% 2015 2016 2017 2018 2019
Return on Capital Employed (ROCE)* 33.6% on pre-IFRS 16 basis 20.0% on IFRS 16 basis
Continued strong cash generation in 2019:
payments (2018: £136.1m)
costs all funded from internally-generated cash flow
special), £7m one-off ‘thank you’ payment to colleagues
Strong balance sheet position:
strength of trading performance and capital expenditure phasing
payable in 2020 (additional outflow of around £11.0 million in first half)
Expect to be in a position to consider scope for special dividend at the time of interim results
16
£169.5m
net cash inflow
£91.3m
net cash at year end
Consider scope for special dividend at time
Roger Whiteside OBE
17
1671 shops 80% High Street Regional structure 1960 shops 65% High Street Shop food to go transformation Breakfast daypart c.2150 shops 55% High Street Manufacturing centres
>2500 shops/ franchise <50% High Street Shop Multi-format Click and collect – customised Evening Daypart – Hot Food Delivery Greggs Rewards CRM Explore development:
INTERNATIONAL/ MULTI-BRAND FOOD-ON-THE-GO NATIONAL BAKERY
2012 2018 2020 2023 Beyond 2025
Dedicated logistics solution Integrated systems Greggs sustainability platform
NEXT GENERATION GREGGS
18
19
Brand health continuing to strengthen
reappraisal of the Greggs Brand
20
Brand marketing improving perceptions
typology and ABC1 demographic
21
Greggs is only 5% of the food-on-the-go market (market estimated at £24bn, 3.7% growth in 2019*)
Grab and Go New Shops Drive Thru Delivery Evening Day Part Click + Collect Made to Order Sit In Greggs Rewards
Single channel Multichannel
wherever, whenever, however customers choose 22
* source: NPD Crest FY2019
0% 10% 20% 30% 40% 50% 60% 70% 80% 90% 100%
2013 (1,671 shops) 2019 (2,050 shops) Future? (2,500+ shops)
Franchise (mainly travel) Work/travel High street 23
supermarkets
(source: NPD Crest, share of visits, FY2019)
24
Number 1
for sandwiches
Number 2
for breakfast & lunch
Number 3
for coffee
Plans for 2020/21 include:
dedicated DC
manufacturing capacity and building a new automated frozen distribution facility at Balliol Park site, Newcastle
Key developments included:
doughnuts at Treforest bakery
25
Significant progress made in investment programme to support shop growth
2019 progress included:
digital capabilities for next phase of development
Plans for 2020/21:
and manufacturing sites
26
Investment programme to modernise core processes and IT systems almost complete
27
Environment
We aim to use energy efficiently and minimise waste
Customer health
We encourage healthier food-on-the-go choices
Responsible sourcing
We care about where our products come from
Community
We share our success with the community around us
People
We are committed to creating a great place to work
February due to storms
– total sales up 13.7% – company-managed shop LFL sales up by 7.5%
stronger-than-normal headwind in 2020
potential impact of Coronavirus
progress in line with our expectations
growth + good returns for all stakeholders
at time of interim results first 9 weeks of 2020 Cost headwinds & uncertainties
Strong financial position
28
Company-managed shop LFL sales up
7.5%