2019 20 proposed budget objectives
play

2019-20 PROPOSED BUDGET OBJECTIVES Role of the Budget Committee - PowerPoint PPT Presentation

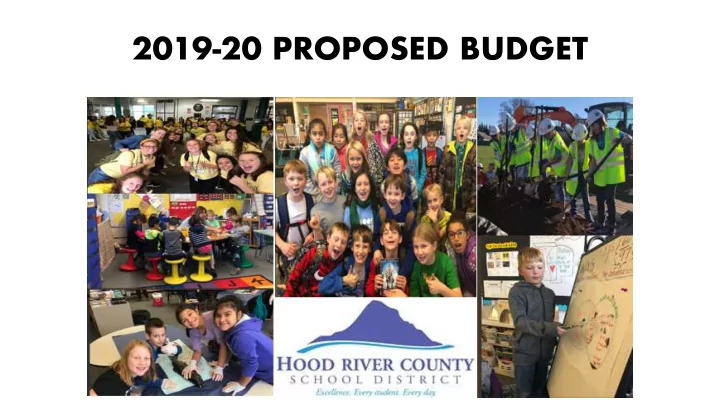
2019-20 PROPOSED BUDGET OBJECTIVES Role of the Budget Committee Organization of the Budget Budget Message & Progress Towards 20/20 Vision Excellence in Financial Accountability Progress of 2016 Capital Projects


  1. 2019-20 PROPOSED BUDGET

  2. OBJECTIVES • Role of the Budget Committee • Organization of the Budget • Budget Message & Progress Towards 20/20 Vision • Excellence in Financial Accountability • Progress of 2016 Capital Projects • Legislative Update • Budget Assumptions • Questions & Deliberations

  3. ROLE OF THE BUDGET COMMITTEE • Receives the budget document & hears the budget message • Hears and considers public comment • Deliberates the budget • Approves the property taxes (permanent rate, local option rate & the bond levy) • Approves the budget (Final authority for programs and services rests with the School Board, who can make changes after budget committee approval)

  4. ORGANIZATION OF THE BUDGET • Section 1. Introduction (p. 1-52) • Budget Message (p. 5-22) • Section 2. Financial Information (p. 53-60) • Section 3. General Fund (p. 61-102) • Section 4. Other Funds (p.103-130) • Section 5. Supplemental Information (p 131-154

  5. STUDENT OUTCOMES – PROGRESS TOWARDS 20/20 VISION • K-12 Attendance • 3 rd Grade Literacy • 5 th Grade Math • 8 th Grade Literacy & Math • Freshman On-Track to Graduate • Seniors Enrolled in 3+ College Courses • 4 Year Graduation Rate

  6. Percent of HRCSD Students Not Chronically Absent 90 88.3 88 87.0 86.4 85.9 85.4 86 84 84 82.6 82 81 80 79 78 76 74 72 70 2016-17 Oregon 2012-13 2013-14 2014-15 2015-16 2016-17 2017-18 2018-19 Target 2020 Target State Average

  7. HRCSD Oregon State Assessment 3rd Grade Reading 60 52.2 50 48.0 46.6 44.0 42.0 38.3 40 38.0 30 20 10 0 2017-18 Oregon 2014-15 2015-16 2016-17 2017-18 2018-19 2019-20 2018-19 Target 2020 Target State Average

  8. HRCSD Oregon State Assessment 8th Grade Math 60 54.9 52.3 49.0 50 43.0 41.0 40.0 40 31.0 30 20 10 0 2017-18 Oregon 2014-15 2015-16 2016-17 2017-18 2018-19 2019-20 2018-19 Target 2020 Target State Average

  9. Percent of HRCSD Freshman On Track 95 90.6 89.7 88.9 90 86.1 85 82.1 80.7 80 75 70 65 60 55 50 2017-18 Oregon 2014-15 2015-16 2016-17 2017-18 2018-19 2019-20 2018-19 Target 2020 Target State Average

  10. Percent of HRVHS Students Graduating On Time 90 89.0 87.7 86.8 85 84.3 83.4 81.8 81.4 81.3 80 78.7 77.40 75 70 65 60 2017-18 2011-12 2012-13 2013-14 2014-15 2015-16 2016-17 2017-18 2018-19 2018-19 2020 Target Oregon State Target Average

  11. EXCELLENCE IN FINANCIAL ACCOUNTABILITY • District earned its fifth consecutive unmodified opinion from external auditors with zero findings - the highest commendation possible • Awarded “Certificate of Excellence in Financial Reporting” by the Association of School Business Officials (ASBO) for fiscal years ending 2017 & 2018 • S&P Global Ratings raised its underlying rating to AA- from A+ on the District’s GO Bonds on improved financial position

  12. PROGRESS OF 2016 CAPITAL PROJECTS • $76.8m resources over the project period beginning 2016 • $57,175,000 General Obligation Bond proceeds approved by voters • $8,601,732 Bond Premium (bonds sold for more than par value) • $4,499,478 State Match Grant • $4,272,821 Seismic Improvement Grant awards from Business Oregon (HRMS, Wy’east MS & Mid Valley Elementary) • $1,502,365 Interest on investments • $755,530 Other

  13. LEGISLATIVE HAPPENINGS PERS Reform • Gov. Brown recommended reforms that propose to stabilize rates moving forward • Requires public employees to contribute to paying down the Unfunded Accrued Liability • Rates already set for this year; don’t expect impact this biennium. • No bill yet connected to Gov.’s Proposal

  14. LEGISLATIVE HAPPENINGS • Student Success Act, HB 3427; Scheduled Senate Vote May 7 • $2b biennial investment in Oregon Public Pre-K – 12 • Business Activity Tax Increase w/ Personal Income Tax Reduction • If enacted and survives likely ballot initiative, $ not until after January 2020 • $1b = Student Investment Account • Lower Class Sizes/More Adults • Well-Rounded Curriculum • Health/Safety/Mental Health • Extended Learning Time • $600m = Statewide Education Initiatives Account • Measure 98, 99 • Long Term Care & Treatment • High Cost Disability • Nutrition • $400m = Early Learning Expansion

  15. LEGISLATIVE HAPPENINGS • State School Fund, HB 5016 • Last week, Ways and Means recommending SSF of $9b • Was $8.87b • Now above Governor’s recommendation of $8.97b (this proposed budget) • SSF = 87.3% of General Fund

  16. ADDITIONAL STAFFING FOR 2019-20 (P.12) Level Description FTE Elem Classroom Teacher - Reduce Average Elementary Classes by 2 3.00 Elem Elementary Student Support Specialist; full time at CL & PD 1.00 Elem Full time Principal at PD; District Early Learning Leadership 0.40 Elem Elementary Associate Principals at MV, May St and WS 3.00 Middle Teacher - Content Area TBD (HRMS) 1.50 Middle Teacher - Content Area TBD (WYMS) 1.50 Middle Classified 8.0 hrs – Bilingual/Behavior Support (HRMS) 1.00 Middle Classified 8.0 hrs - Bilingual/Behavior Support (WYMS) 1.00 High Teacher - Math/Elective – HR Options Academy 0.50 High Teacher - Freshman Success 0.50 High Teacher - Community Works 0.50 District Technology Instructional Coach (partially maintains bond-funded position) 0.50 District C&I - Assessment Coordinator (TOSA) 1.00 District Controller position to support District Business Services 1.00 District Student Services - Instructional Coach (TOSA) 1.00 District Maintenance 1.00 Total 18.40

  17. PROPOSED BUDGET AND ASSUMPTIONS • Financial Summary • Program Changes for 2019-20 • General Fund • State School Fund • Enrollment • Local Option Levy

  18. FINANCIAL SUMMARY (p. 53)

  19. TOTAL FUNDS EXPENSES $93.3M General Fund 56.0% $53,421,012 Food Service Fund 2.0% $23,606,627 Student Body Funds 2.0% Community Education 1.4% Biennial Reserve 1.5% $4,425,400 Unemployment Fund 0.1% $7,050,000 Bus Replacement Fund 0.2% $196,206 Grant Funds 7.4% $60,000 Debt Service Fund 4.6% $1,448,113 $1,335,567 Capital Construction and Improvements 24.8% $1,880,214 $1,900,000

  20. GENERAL FUND OPERATING REVENUE $50.7M $873,900 $680,789 $13,700 $2,268,710 $3,659,368 State School Fund Resources 85.2% Local Option Resources 7.2% ESD Revenue 4.5% Other Local 1.7% Other State 1.3% Other Federal <1% $43,180,597

  21. STATE SCHOOL FUND • State School Fund Resources 85.2% of General Fund • State School Fund Estimated on Governor’s Proposed Budget of $8.972 billion split 49%/51% • Local property taxes, Common School Fund, State timber money, Federal forest fees are all considered resources of the State School Fund • Student Enrollment (ADM) is the most important factor in projecting SSF revenue • Weighted student enrollment drives funding (ADMw) • Extended ADMw is the greater of the current or prior year’s ADMw More detailed information is shown on pages 57-60

  22. ENROLLMENT FORECAST Year Ended ADM ADMw Extended ADMw 2016 4,055.30 5,083.29 5,083.29 2017 4,057.51 5,066.28 5,083.29 2018 3,998.12 4,995.07 5,066.28 2019 3,994.56* 4,990.47* 4,995.18* 2020 3,837.00* 4,800.87* 4,989.61*

  23. LOCAL OPTION LEVY • Approved Local Option Levy Rate of $1.25/$1,000 TAV • Proposed budget estimates local option levy resources based on $1.20/$1,000 TAV imposed • With District’s financial position, we propose reducing the imposed local option levy rate and assumed lower resources from both the levy and the local option equalization grant More information is shown on pages 46-48

  24. GENERAL FUND OPERATING EXPENSES $53.4M $380,078 $263,443 $20,149,657 Instruction 61.1% Support Services 37.7% $32,627,835 Debt Service 0.5% Contingency 0.7%

  25. GENERAL FUND EXPENSE BY OBJECT $53.4M $2,541,442 $54,492 $722,410 $380,078 $4,454,144 Salaries 51.2% Assoc. Payroll Costs 33.5% $27,361,941 Purchased Services 8.3% Supplies & Materials 4.8% $17,906,504 Capital Outlay 0.1% Other Goods & Services 1.4% Contingency 0.7%

  26. STAFFING & BUDGET ASSUMPTIONS • Total staffing of 522.2 FTE (full-time equivalent) • 450.39 FTE General Fund • 20.31 FTE Food Service Fund • 13.85 Community Education Fund • 37.65 Grant Funds • Staffing allocation based on projected enrollment of 3,837 students More information is shown on page 37

  27. BUDGET ASSUMPTIONS - PERS Employee 2017-19 2019-21 Change to Percentage Membership Tier Current Rate Adopted Rate Contribution Rate Increase Tier 1/Tier 2 16.03% 20.03% 4.00% 25% OPSRP 10.70% 14.58% 3.88% 36.3%

  28. District Total PERS Rates as a Percent of Salary includes employer contribution rate, pickup & pension bond rate 40.00% 35.53% 35.00% 31.53% 29.29% 30.00% 26.76% 30.08% 25.00% 27.29% 26.20% Total Tier 1/2 20.00% 22.07% Total OPSRP 15.00% 10.00% 5.00% 0.00% 2013-15 2015-17 2017-19 2019-21

  29. OTHER BUDGET ASSUMPTIONS • Collective bargaining agreements in place through the end of 2019-20 • Other employment agreements in place through the end of 2019-20 • District contributions for health insurance costs estimated using best available information • PERS exact rates used for filled positions. OPSRP rates used for vacancies. • No change assumed in workers’ compensation premium rates • Current Social security, Medicare, unemployment and workers’ benefit fund assessment rates were assumed

Download Presentation
Download Policy: The content available on the website is offered to you 'AS IS' for your personal information and use only. It cannot be commercialized, licensed, or distributed on other websites without prior consent from the author. To download a presentation, simply click this link. If you encounter any difficulties during the download process, it's possible that the publisher has removed the file from their server.

Recommend


More recommend